
Manual

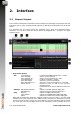
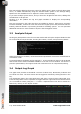

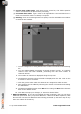
Table Of Contents

queues will be restored.
2. Queue Tabs. Each tab represents the items in a queue. You can double-click the tab
to display the settings for that queue. Click on the X button within the tab to close the
queue (and stop processing items in it) - it will be removed from the workspace. With
a tab selected, only the items in the selected queue are visible. Initially, the name of
the tab will be automatically generated. Once you save the settings for that queue,
the filename you choose will be displayed on the tab instead.
3. Add Queue. This button will add an extra queue (if you have sufficient licenses
available). By default, AMB will allow you to create 2 queues. Additional queues can
be purchased for greater flexibility.
4. Queue Controls. These buttons control the currently displayed queue (or all queues
if the ’All Queues’ tab is active (see below)). The first button pauses the queue - it will
flash when the queue is paused and a small pause icon will appear on the queue tab.
The second button will unpause the current queue. It will be green when the queue
is running. If you are looking at the ’All Queues’ tab and some, but not all queues
are paused, then both the play button and pause button will be illuminated. The final
button will clear the queue. This stops any processing that is currently taking place
and removes all items from the queue (both those that have been processed and those
that were still waiting). Note that some parts of the process require OS actions such
as copying/moving files to complete. These cannot be interrupted so processing may
take a moment to come to a halt.
5. All Queues. This tab is only visible if you have 2 or more queues in your workspace.
With this tab selected, you can see all of the files in all of the queues. An extra column
is displayed which indicates which files belong to which queues.
6. Shortcuts. These shortcuts (in left to right order) allow you to:
(a) Toggle the log window on/off.
(b) Toggle the graph window on/off.
(c) View watch folder - if the current queue has a watch folder enabled, clicking this
button will open that folder for you.
(d) View output folder - if the current queue creates any output files, clicking this
button will open the target folder for you.
The log and graph information will still be collected if their windows are not displayed.
7. Processing queue. This area shows the files queued for processing, and previously
processed in this session, in tabulated summary, with results of analysis and any
correction applied.
8. Analysis output window. Clicking any file in the processing queue will generate a
detailed summary of any analysis and correction associated with the current session.
9. Zoom. Clicking on this icon opens a new window containing the graph data (see
below). You can resize the new window to provide more detailed information.
10. Output graph. The graph area provides a thumbnail overview of Short-term,
Momentary loudness and True-Peak over time. The three traces can be toggled on
and off by clicking the title in the key.
2.2 Processing Queue
This area of the interface gives an overview of the files to be analysed and/or corrected,
along with a summary of any loudness data generated.
Drag and drop files here to add to the processing queue. Once data is generated, it is
tabulated in summary columns to the right hand side of the window. Corrected files are
shown below the original file.
5 © 2016 NUGEN Audio www.nugenaudio.com