
User Guide

NTI E-MNG-LC Environment Monitoring System Management Software
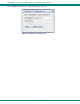
To copy the graph image to your computer’s clipboard for pasting into another document, click
“Copy”.
T
o
save the graph image as a .png image file on your computer, select “Save as….” .
To send the graph image to a printer, select “Print…”.
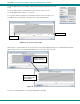
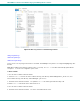
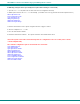
To see greater detail in the graph, the range and/or domain axis can be zoomed in or out.
To quickly return to a normal view of the graph, click on “Auto Range-Both Axes”.
Domain Axis
Ran
g
e Axis
Figure 37- You can zoom your axes
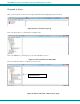
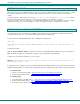
Another way to see greater detail is to select a specific area on the graph dragging from the top in a downward diagonal motion.
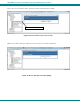
When you let go of the mouse the graph will update with a closeup of the area you selected.
27
Figure 38- Drag a selected area to zoom in on
To restore the default appearance of the graph, drag upward on the graph.
Drag to select an
area to zoom in on
A closeup view of
those readings will
be presented.