
User Guide

NTI E-MNG-LC Environment Monitoring System Management Software
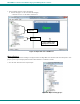
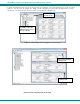
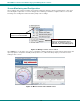
Select “Data Recording Status” and then click “Start Recording” to have the readings for the sensor stored in memory. Once
the start recording, a graph will be created from the readings taken. Readings will be stored for up to 120 days, after which old
readings will drop off to make room for new readings.
26
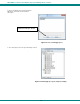
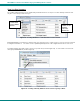
To view the readings stored, select “View History Graph”.
Figure 35- View History Graph
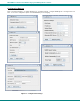
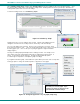
A graph that shows a sensor’s readings can be viewed. The time period displayed can be
changed to show the last hour, last day, last week, last 30 days or the last 120 days.
The color of the graph can be changed. Click on “Color” to bring up a color chart. Select
the desired color and press “OK”. (The color change will only take effect as long as you have
the history graph op
en. Once closed, upon reopening the graph the original color will be
displayed again.)
The range of readings displayed will adjust as the readings are taken. For example, in the
above image, for the time period displayed the range of readings was between 38.2°F. to
39.2°F.
If expanded to view the Last Day, the range would automatically update
to a wider range of temperatures and adjust the graph accordingly.
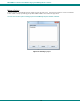
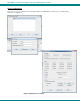
If you right-click inside the graph, a menu with more options will be presented. Click on “Properties”
to bring up options to change the “Chart Properties” or appearance of the graph.
Note: The changes you make will only take
effect u
n
til you close the graph. Upon
reopening the graph, the appearance will
again be based on default settings.
Figure 36- Change the appearance of your graph (temporary)