
User's Manual


Table Of Contents
- Getting Started with the Business Policy Switch 2000 Management Software
- Contents
- Figures
- Tables
- Preface
- Chapter 1: Management basics
- Chapter 2: Installing Device Manager software
- Chapter 3: Device Manager basics
- Chapter 4: Web management interface basics
- Index
50 Chapter 3 Device Manager basics
209321-A
5 Click one of the graph buttons at the bottom of the dialog box (see “Types of
graphs” on page 44).
A graph dialog box opens for the selected graph type.
6 To print a copy of the graph, click Print.
Buttons at the top of the graph dialog boxes for line, area, and bar graphs allow
you to change the orientation of the graph, change the scale, or change the graph
type. Table 11 describes the buttons in the graph dialog boxes.
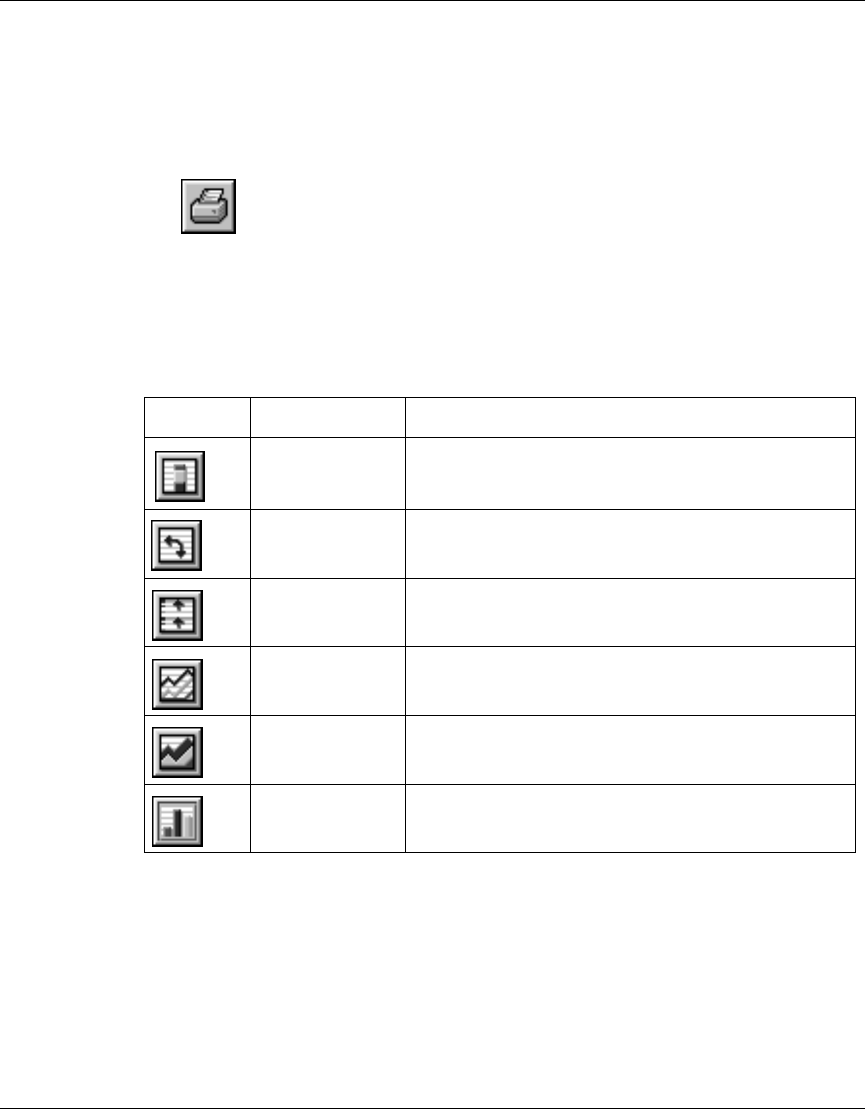
Table 11 Graph dialog box buttons
Button Name Description
Stacked “Stacks” data quantities instead of displaying them
side-by-side.
Horizontal Rotates the graph 90 degrees.
Log Scale Changes the scale of the x-axis (of an unrotated graph)
from numeric to logarithmic.
Line Chart Converts an area graph or bar graph to a line graph.
Area Chart Converts a line graph or bar graph to an area graph.
Bar Chart Converts a line graph or area graph to a bar graph.