
User's Manual


Table Of Contents
- Getting Started with the Business Policy Switch 2000 Management Software
- Contents
- Figures
- Tables
- Preface
- Chapter 1: Management basics
- Chapter 2: Installing Device Manager software
- Chapter 3: Device Manager basics
- Chapter 4: Web management interface basics
- Index
Chapter 3 Device Manager basics 49
Getting Started with the Business Policy Switch 2000 Management Software
Viewing statistics as graphs
To create a graph for an object:
1 Select the object or objects to be graphed (see “Selecting objects” on
page 37).
2 Do one of the following:
• On the toolbar, click Graph Selected.
• From the shortcut menu for the object, choose Graph.
• From the main menu, choose Graph > Chassis or Graph > Port.
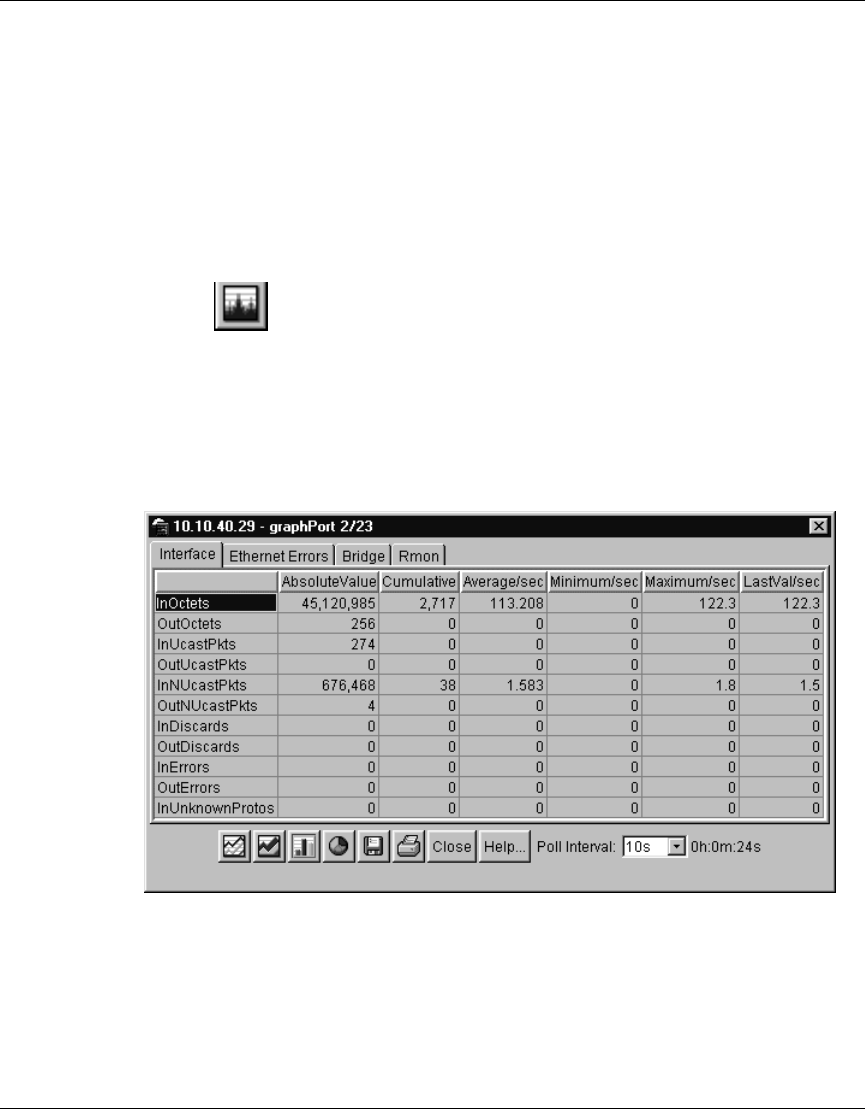
A statistics dialog box opens with tabs for different categories of statistics for
the selected object (Figure 20).
Figure 20 Statistics dialog box for a port
3 Select a tab for the group of statistics you want to view.
4 On the displayed data table, drag to select the cells you want to graph. (They
must be in the same row or column.)