
User's Manual


Table Of Contents
- Getting Started with the Business Policy Switch 2000 Management Software
- Contents
- Figures
- Tables
- Preface
- Chapter 1: Management basics
- Chapter 2: Installing Device Manager software
- Chapter 3: Device Manager basics
- Chapter 4: Web management interface basics
- Index
48 Chapter 3 Device Manager basics
209321-A
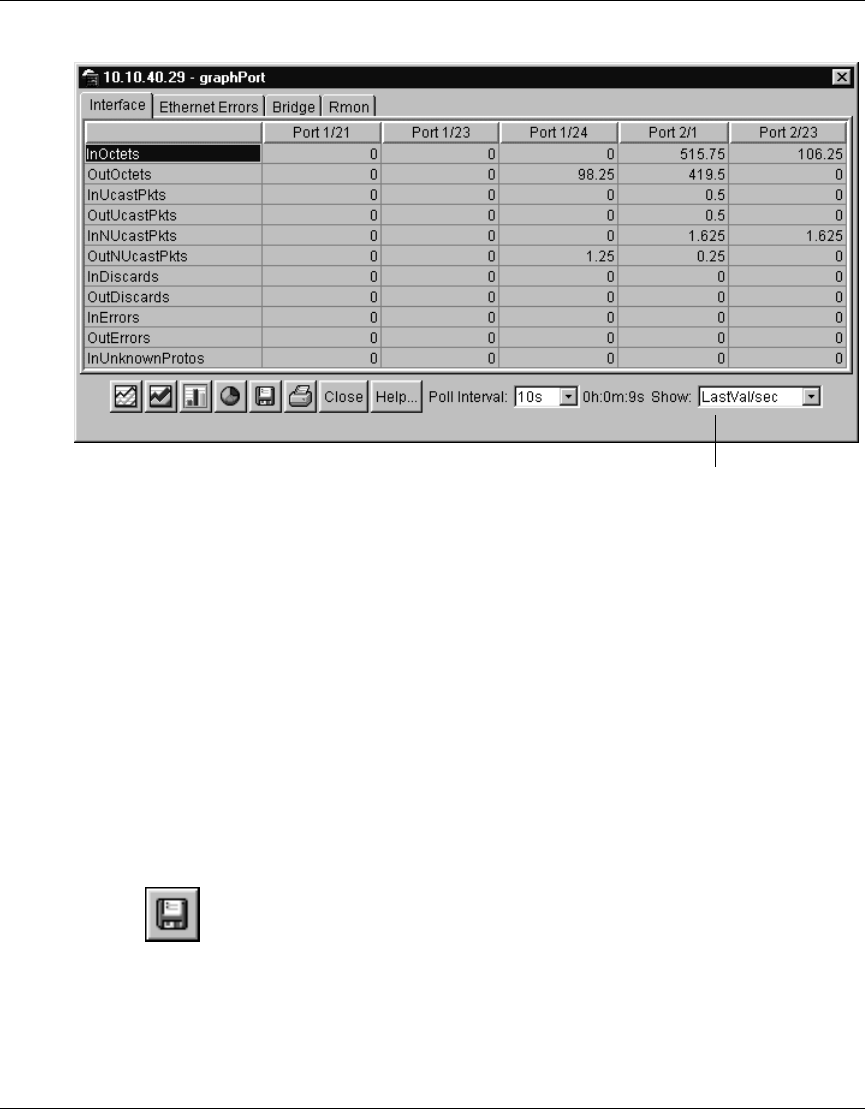
Figure 19 Interface statistics for multiple ports
To change the type of statistics displayed, select a different type from the show list
at the bottom of the dialog box.
The statistics are updated based on the poll interval shown at the bottom of the
dialog box. You can select a different polling interval.
Buttons for bar, pie, and line graphs are located at the bottom of a statistics dialog
box. See the next section, “Viewing statistics as graphs,” for instructions to use
these buttons.
You can export the statistics to a tab-separated file format and import the file into
other applications. To export the information, use the Export Data button below
the table.
Statistics type