
- Nortel Ethernet Routing Switch Owner's Manual

Working with statistics and graphs 135
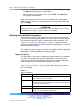
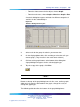
Statistic
Description
Maximum The maximum average for the counter for a given polling
interval over the cumulative elapsed time.
LastValue The average for the counter over the last polling interval.
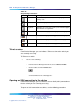
Types of graphs
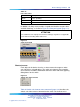
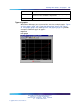
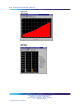
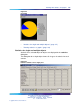
With Device Manager, you can create line, area, bar, and pie graphs. Figure
39 "Line graph" (page 135), Figure 40 "Area graph" (page 136), Figure
41 "Bar graph" (page 136), and Figure 42 "Pie graph" (page 137) provide
examples of different types of graphs.
Figure 39
Line graph
Nortel Ethernet Routing Switch 2500 Series
Overview — System Configuration
NN47215-500 (323162-B) 02.02 Standard
4.1 19 November 2007
Copyright © 2007, Nortel Networks
.