
User's Manual


options and the word ''Saved'' will be displayed in green at the bottom
of the dashboard.
NOTE : You can open the 3D graphs you saved in the ARCHIVES and
perform all the functions above, later as well.
(4) DELETE
Once the result screen is saved, ''Delete'' will be displayed instead
of ''Save'' under 3D GRAPH OPTIONS. When delete is selected, the
warning message ''Are you sure you want to delete the data?'' as
well as the record number will appear on screen. If you press the OK
button, a progress bar will appear in a window. Once the progress bar
is full, you will see the message ''Data is successfully deleted!'' Upon
deletion, ''Save'' will be displayed again instead of ''Delete'' function.
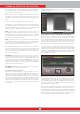
DASHBOARD
This will show up when you remove the 3D GRAPH OPTIONS by
pressing the SETTINGS button on the result screen. The DASHBOARD
will display the date and time, the search mode, the frequency, and
the type of search coil used when the data was obtained as well as
the resolution of the graph.
If you press the SETTINGS button while the dashboard is displayed,
the 3D GRAPH OPTION will come back on screen.
If you wish, you can remove the DASHBOARD from the screen by
pressing the INFO button and view the graph in a larger screen.
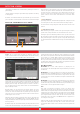
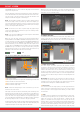
On the right is a sample result screen obtained in the Ground Anomaly
& Cavity mode :
This is the initial top view:
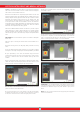
This is the 3D graph that can be viewed 360° using the directional
buttons :
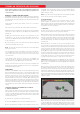
On the graph above, when you press the OK button, the below graph
appears showing the target ID :
This is the graph showing the scanned area from start to finish and
all the sweeps :
29
RESULT SCREEN