WAN Probe Kit Installation & Quick Start Guide August 2003
Trademark Notices © 1994-2004 by Network Instruments, LLC (Limited Liability Corporation). All rights reserved. “Observer”, “Network Instruments” and the “N with a dot” logo are registered trademarks of Network Instruments, LLC, Minneapolis, Minnesota, USA. Limited Warranty—Hardware Network Instruments, LLC. ("Network Instruments") warrants this hardware product against defects in materials and workmanship for a period of 90 days from the date of shipment of the product from Network Instruments, LLC.
Technical Support Network Instruments provides technical support: By phone (depending on where you are located): US & Countries outside Europe at (952) 932-9899 UK and Europe at +44 (0) 1959 569880 By fax (depending on where you are located): US & Countries outside of Europe at (952) 932-9545 UK and Europe at +44 (0) 1959 569881 Or by email at: support@networkinstruments.com Network Instruments provides technical support for a period of 90 days after the purchase of the product at no charge.
Contents Getting Started ................................................................................... 1 Installation Overview ............................................................................................ 1 Unpacking and Inspecting the Parts .................................................................... 2 Hardware and Software Requirements ................................................................ 3 Hardware Requirements ......................................................
iv WAN Probe Kit Installation and Quick Start Guide
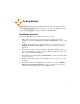
Getting Started Thank you for purchasing Network Instruments WAN Probe Kit. The WAN Probe Kit, when coupled with Network Instruments Observer ® software, offers full-featured frame capture, decode, and analysis for T1/E1, DS3/E3 and HSSI WAN links. Installation Overview To install the WAN Probe Kit, you must follow these overall steps: 1. Make sure that your system meets the requirements for hardware and software installation as described in Hardware and Software Requirements on page 3 of this Guide. 2.
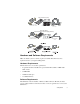
Unpacking and Inspecting the Parts Your WAN Probe Kit includes a number of components. Take a moment after unpacking the kit to locate and inspect all of the parts.
Digital T1/E1 TAP Kit (4-Port) LINK 1 MONITOR TX IN LINK 1 MONITOR TX IN Two (2) T1/E1 WAN Interface Cards & Cables MONITOR RX LINK 2 MONITOR TX OUT IN MONITOR RX OUT MONITOR RX OUT LINK 2 MONITOR TX IN : MONITOR RX OUT Two (2) T1/E1 Dual Link TAPs Two (2) T1/E1 Cables Serial T1/E1 TAP Kit (V.
WAN Probe Kit Quick Installation Diagrams Follow the diagrammed steps below to install the WAN Probe Kit. More detailed NIC and software installation instructions follow in this Guide. Digital T1/E1 TAP Quick Installation Diagram (2-Port1) The diagram below shows the WAN Probe Kit as it would be cabled to analyze a digital T1/E1 link with a Channel Service Unit/Data Service Unit (CSU/DSU). For a DS3/E3 and Serial T1 cabling diagrams, see the following pages.
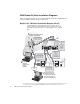
Digital DS3/E3 TAP Quick Installation Diagram the interface cards, 1Install drivers, and cabling. DS3 TAP Frame Relay Card DTE B Connect Interface card to TAP with Interface cable. DCE LOS A A LOS LOF IN (TX) Probe Servic e Runnin g 2 Install the Network Instruments Probe software. Use the supplied 10/100 cable to connect the Probe to a TCP/IP LAN with an Observer system attached.
Serial T1 TAP Quick Installation Diagram Splitter cable patched between DTE and DCE TX TX RX RX CSU/DSU DTE TX TX RX RX Router (DCE) the interface cards, 1Install drivers, and cabling. INPUT WAN Card B 10/100 NIC DTE A MODE A POWER A Serial T1/E1 TAP B DCE ACTIVE OUTPUT Probe Servic e Runnin g the 2 Install Network TCP/IP LAN Use the supplied 10/100 cable to connect the Probe to a TCP/IP LAN with an Observer system attached. Instruments Probe software.
HSSI TAP Quick Installation Diagram WAN Card the interface cards, 1Install drivers, and cabling. 10/100 NIC INPUT B 2 Install the Network Instruments Probe software. Probe Servic e Runnin g T3 WAN MONITOR TAP MO POWER OUTPUT TO PROBE HSSI TAP HSSI IN HSSI OUT TCP/IP LAN Observ e Conso r le 3 Use the supplied 10/100 cable to connect the Probe to a TCP/IP LAN with an Observer system attached. From the Observer Console, the newlyconfigured Probe will now be available on Observer’s Probe List.
1. Install the Interface Cards, Drivers, and Cabling The TAP kit allows the Probe to capture frames from a T1/E1 or DS3/E3 link. The 10/100 NIC allows the Probe to communicate with the Observer console via TCP/IP, or to capture packets from a 10/100 network. • For detailed card installation instructions, refer to Installing the Interface Cards on page 10 of this Guide. For driver installation instructions, refer to Updating the WAN and 10/100 Drivers on page 11 of this Guide. 2.
Installing the Interface Cards and Drivers Safety and Handling Precautions ! Danger! Electrical current from power, phone and communications cables can be hazardous. To avoid potential shock hazards: • Only use grounded sockets for connecting equipment to the power supply. • Do not carry out any installation, maintenance or (re)configuration work and do not connect or disconnect any power cables during an electrical storm.
Installing the Interface Cards Have the computer manual available and if necessary, a key or screwdriver to open the cover. 1. Install the Network Instruments Probe Software as described in the RMON1/2 & Advanced Probe User Guide. You must install this software before you install the hardware so that Windows will have access to the custom drivers. 2. Switch off the computer in which the network cards are to be installed. 3. Disconnect the power cord from the power outlet.
Make sure that the contacts of the network cards are correctly aligned with the PCI bus slots on the motherboard. Push the network cards down vertically until they are properly seated in the bus slots. 10/100 Ethernet NIC WAN Interface 9. Tighten the locking screws on the fixing brackets until the cards are firmly connected to the computer cover (or to the attachment provided for expansion cards). 10. Close the computer cover and replace and tighten any screws. 11.
WAN and 10/100 Driver Installation: Windows 2000 The procedure for each NIC is different because of the way Windows 2000 recognizes the two cards: • The WAN Interface card isn’t recognized at all, so you need to have already installed the Network Instruments Probe software when you turn the system on. When the Found New Hardware wizard asks you for the driver location, specify the C:\Observer Files\Drivers\WAN directory, which contains the custom driver for the WAN Interface card.
2. Choose “Search for a suitable driver for my device.” Click Next. The wizard asks where it should look for the driver files: 3. Choose “Specify a Location” and click Next. The wizard displays a file locator: 4.
The wizard tells you which driver it found: 5. Click Next. The wizard informs you that the driver it found lacks a Microsoft digital signature: 6. Click Yes. Network Instruments has tested and verified that the driver works correctly with Observer and Probe on Windows 2000. After installing the driver, the wizard displays a confirmation dialog telling you that the driver was successfully installed. Click Finish to close the wizard.
Manually Updating the 10/100 NIC Driver by Specifying a Directory Although Windows 2000 reports that it found the correct driver for the Network Instruments 10/100 NIC, the standard driver that it has installed needs to be updated to work best with Network Instruments Probe or Observer. A custom driver is required to make the 10/100 NIC work optimally with Probe and Observer. Therefore you must manually update the driver as described in the following steps. 1.
The Upgrade Device Driver Wizard’s Welcome dialog is displayed. Click Next and the wizard asks you whether you want to search for a driver or pick one from a list: 16 4. Choose “Search for a suitable device” and click Next. The wizard asks you where to search for the driver: 5. Choose “Specify a Location” and click Next.
The wizard displays a file locator dialog: 6. Enter (or browse to) the following path (assuming the Observer directory is C:\Observer): c:\Observer Files\drivers\intel21143\win2000 7.
8. Choose “Install one of the other drivers” and click Next. The wizard shows a list of drivers to pick from: 9. Choose “Network Instruments Intel 21143 Based Adapter Driver” and click Next. After installing the device driver, the wizard displays an information dialog telling you that the driver was successfully installed. Click Finish to complete the driver installation.
Manually Updating the NIC Drivers 1. From the desktop Start menu, highlight My Computer and right-click. Choose Properties... on the pop-up menu. Click the Hardware tab on the resulting properties dialog, and the following is displayed: 2. Click Device Manager... The Device Manager browser is displayed: 3. Browse to and right-click on the Network Adapters > WAN Analyzer driver (which will be named according to type: Digital T1/E1, DS3/E3, or Serial T1).
Properties... and click the Driver tab on the resulting dialog, which will display the properties for that device. 4. Click Update Driver..., The Hardware Update Wizard asks you how you want it to install the driver: 20 5. Choose “Install from a specific location” and click Next. The wizard then asks where to look for the file: 6. Select “Don’t search...I will choose the driver to install.” and click Next.
The Wizard then shows you what it thinks is the matching driver: 7. Click Have Disk..., and a file locator dialog is displayed: 8.
The wizard then displays the driver it found: Depending on which card you have installed, one of the following adapters will be listed: DS3/E3/HSSI WAN Analyzer (Digital) T1/E1 WAN Analyzer (Digital) T1 WAN Analyzer (Serial) 9. Click Next.
10. Click Continue Anyway. Network Instruments has tested and verified that the driver works correctly with Probe and Observer on Windows XP. 11. After the wizard finishes installing the driver, Click Finish to close the confirmation dialog. 12. Repeat these same steps for updating the 10/100 NIC. When asked to specify a location for the driver, enter (or browse to) this path (assuming C:\Observer Files is your Observer directory): c:\observer files\drivers\intel21143\win2000 13.
performed a Clear All and Rescan), the utility will assign a logical link to each port, as shown in this two-card example: To create a link, use Shift+Click to select the ports you want to add to the link and choose Link->Add Selected Ports to Link->New... from the main menu (or right-click menu). The utility prompts you to name the link. As you create links, they are added to the Link menu for easy selection. The example below shows the display after a number of logical links have been configured.
Digital T1/E1 TAP LOOP Should remain unlit for normal operation. NETWORK INTERFACE UNIT E1 T1 RJ BANTAM LOOP E1 T1 POWER TEST TO PROBE RJ BANTAM Leave setting on RJ position. INTERFACE SELECTOR POWER light should be lit whenever TAP is cabled to Interface Card. Digital DS3/E3 TAP Loss of Signal, —unlit when the given device (DTE or DCE) drops carrier. DSE DTE DCE LOS IN LOF LOS OUT POWER IN LOF OUT Loss of Frame —unlit when the given device (DTE or DCE) drops a frame.
26 TAP Status LEDs and Switches
Running Observer Software with the WAN Probe After you have installed the WAN Probe Kit hardware, drivers, and Probe software, you can run Network Instruments Observer to connect to the Probe and begin analyzing the network. To connect to the Probe, follow these steps: 1. Start Observer. From the Tools menu, select Redirect Probe... 2. Enter the name and IP address of the Probe system. You can now select the Probe from the Observer Probe list.
Digital DS3/E3/HSSI Probe Settings Setting Explanation WAN/Frame Relay Type Choose DS3 (T3) , E3 or HSSI to match the type of link you are analyzing. Encapsulation You must set this to match the settings on the frame relay CSU/DSU. The encapsulation options are: -ATM-DXI - ATM Data Exchange -Frame Relay - Cisco -Frame Relay - IETF Standard -HDLC - Cisco Proprietary -LAPB (modulo-128) -LAPB (modulo-8) -PPP - Point-to-Point Protocol -X.25 over LAPB (modulo-128) -X.
Setting Explanation Subprotocol If ATM or LAPB is the selected encapsulation method, you must choose the subprotocols on the link. ATM subprotocol choices are NLPID and SNAP multi-protocol; LAPB subprotocol choices are IP and Ethertype multi-protocol Link 1 and Link 2 Channel Settings (Note that for the link and settings to be activated, you must check the “On” checkbox for that link). Fractionalized Check if this link is configured for fractionalized operation.
• Efficiency History • Replay Packet Capture Analyzing a WAN Link with Observer In general, the WAN analysis works much like Ethernet analysis. One difference is that, when appropriate, Observer identifies WAN links by their Data Link Connection Identifier (DLCI) rather than by MAC address as is done with standard protocol analysis. In addition, many WAN statistical modes break out the data by DCE, DTE, and summary to reflect the full-duplex nature of WAN links.
To set the CIR for a DLCI or group of DLCIs, click the edit DLCI CIR button on the Discover Network Names mode window. The following dialog is displayed: Add a DLCI (or select one from the list and click Modify). Type or use the spinbox to set the CIR in Kbits/sec for the DLCI. Click OK when you are done. WAN Bandwidth UtilizationI To see the percentages of bandwidth saturation on DCE, DTE and DCE+DTE (Summary) for each configured link, choose Statistics->Bandwidth Utilization.
pie, graph and dial views. The display setup dialog (click Settings to access), lets you choose what ports to display as well as color and scale options. The Bandwidth Utilization display is not subject to any filters as it compares the actual activity on the network to the network’s theoretical capacity. WAN Vital Signs by DLCI In WAN Observer, the Network Vital Signs display is replaced by the WAN Vital Signs by DLCI mode. This mode provides a summary of the errors occurring on a WAN link (E1/T1/DS3/E3).
Column Description DTE FECN under CIR The number of packets seen on the DTE side of the link that had the Forward Explicit Congestion Notification bit set, even though the bandwidth usage was within the Committed Information Rate (CIR). Normally this number should be zero. If bandwidth usage exceeds CIR, congestion is expected.
The WAN Load by DLCI mode in dial view shows transfer rate, CRC error rate, FECN/BECN frame rates graphed on dial meters. DLCI CIR Setup Click Settings and then the DLCI CIR Setup tab to display a dialog that lets you enter DLCIs and their corresponding Committed Information Rates. You can eithe enter the DLCIs manually, or automatically add DLCIs from Observer’s current alias list.
Top Talkers Just as in standard Observer, Top Talkers shows the IP and MAC address of stations on your network sorted by volume of traffic generated and received. In WAN Observer, the MAC Address tab shows DLCIs sorted by volume of traffic. Also, the sorting and charting statistical criteria (such as percentage of packets, packets per second, etc.) that apply to WAN is a subset of those available for standard network analysis.
Choose the desired filter rule from the menu. A dialog is displayed letting you set the filter rule options. Refer to the Observer Reference Guide and online help for further information about using filters and editing rules. Triggers and Alarms WAN Observer adds WAN-related criteria to the standard Triggers and Alarms mode. Click the button located in the lower left corner of Observer’s main window.
Check the alarms you wish to set, then click the Triggers tab to set the criteria by which the alarms will be triggered: Note that most WAN alarms can be set on the DTE or DCE side or both; note also that the Committed Information Rate displayed is that which you set in Discover Network Names mode. See “Setting the Committed Information Rate (CIR) for a DLCI” on page 30. The Actions tab lets you define actions to launch if an alarm is triggered. You can log messages, send email, or even send a pager alarm.
Notes: 38