
User Manual


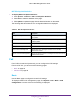


Table Of Contents
- M6100 Web Management User Guide
- Contents
- 1. Getting Started
- 2. Configuring System Information
- 3. Configuring Switching Information
- 4. Routing
- 5. Configuring Quality of Service
- 6. Managing Device Security
- 7. Monitoring the System
- 8. Maintenance
- 9. Help
- A. Default Settings
- B. Configuration Examples
- C. Notification of Compliance

Configuring System Information
94
M6100 Web Management User Guide
NSF Checkpoint Statistics
To display NSF Checkpoint Statistics:
1. Click System
Chassis > NSF > Checkpoint Statistics.
2. Click Clear to reset the statistics on the page.
3. Click Update to update the page with the latest information on the switch.
The following table describes the non-configurable data that is displayed.
Table 51. NSF Checkpoint Statistics
Field Description
Messages Checkpoint Displays the number of messages sent from the Supervisor to the
backup blade.
Bytes Checkpointed Displays how much data has been sent from the Supervisor until to
the backup blade.
Time Since Counters Cleared Displays the amount of time since the counters have been reset.
Checkpoint Message Rate Indicates the number of seconds between measurements.
Last 10-second Message Rate Indicates how many messages have been sent in the last
measurement interval.
Highest 10-second Message Rate Indicates the highest number of messages that have been sent in
a measurement interval.
PoE
From PoE link under the System tab, you can configure the PoE settings.
From the PoE link, you can access the following pages:
• Basic on page 94
• Advanced on page 96
Basic
Use the Basic page to configure the basic PoE settings.
To display the Basic PoE Configuration page, click System > PoE > Basic > PoE
Configuration.
A screen similar to the following is displayed.