
Reference Manual


Monitoring
42
ProSafe 16 AP Wireless Management System WMS5316
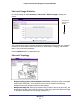
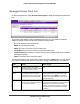
Network Usage Statistics
On the Monitoring tab select Summary > Advanced > Network Usage to display this
screen:
Scroll down to
view wireless
statistics.
The screen displays plots of average received and transmitted network traffic per managed
access point. Three different plots show Ethernet, wireless 802.11 b/bg/ng, and wireless
802.11 a/na mode traffic separately.
Click the Refresh button to update the plots.
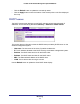
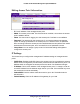
Network Topology
• Display topology graph of the managed Access Points. It displays a graph of managed
access point connectivity. The access point icons can be moved on the topology
background and their locations saved for later displays.
• Background Image File: Specify the image file that you want to use for the floor map. The
image should be 800 x 600 in size and can be in either jpg or gif format. When the image
is uploaded it is displayed as the topology background.