
Quick Reference Guide

Maintain the Wireless Controller and Access Points
162
ProSAFE Wireless Controller WC9500
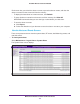
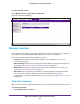
View Alerts and Events
The wireless controller lets you view the following alerts and events:
• System alerts. System alerts such as an access point coming up or being shut down,
the wireless controller coming up or being shut down, and a firmware upgrade.
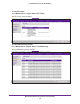
• RF events. Radio frequency events such as the detection of a coverage hole, a
change of channel, or a managed access point going down.
• Load balancing event. Load-balancing events such as a bad RSSI for a client, or the
violation of a load-balancing threshold.
• Rate limiting events. Rate-limit events such as the violation of a rate-limit threshold.
Note: The Logs & Alerts menu includes Redundancy and Stacking links.
Redundancy and stacking will be supported in a future release.
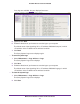
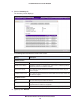
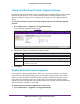
Common Components on the Alerts and Events Screens
Each screen that displays alerts or events contains a table with three columns:
• Severity. The alarm severity level: All, Minor
, Normal, Major, or Critical. You can sort the
table on severity level by clicking the icon next to the Severity header in the table.
• Description. The description of the alert or event, which is self-explanatory.
You can sort
the table on description by clicking the icon next to the Description header in the table.
• Raised Time. The date and time that the alert or event was raised.
You can sort the table
on time by clicking the icon next to the Raised Time header in the table.
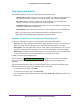
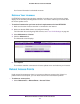
A table can extend over multiple pages.
The progress bar (
) shows only when many components
(such as access points or clients) are retrieved and require two or more pages to be
displayed.
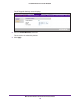
You can navigate through a table by using the following links and menu that display at the
bottom of the table only if there are sufficient entries in the table:
• To move to the next page, click Next.
• To move to the previous page, click Previous.
• To change the number of entries onscreen, select 20
, 40
, 60, 80, or All from the Entry Per
Page menu.