
Quick Reference Guide


Chapter 6. Monitoring System Access and Performance | 185
ProSecure Web/Email Security Threat Management (STM) Appliance
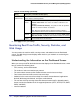
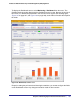
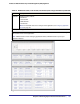
To display the Dashboard screen, select Monitoring > Dashboard from the menu. The
Dashboard submenu tabs display with the Dashboard screen in view. Because of the size of
this screen, it is divided and presented in this manual in three figures (the following figure,
Figure 107 on page 187, and Figure 108 on page 189), each with its own table that explains
the fields.
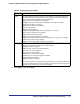
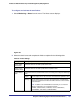
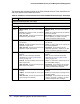
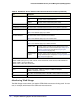
Figure 106. Dashboard, screen 1 of 3
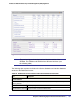
Except for setting the poll interval and clearing the statistics, you cannot configure the fields
on the Dashboard screen. Any changes need to be made on other screens.