
Quick Reference Guide

Appendix A. Report Templates | 243
ProSecure Web/Email Security Threat Management (STM) Appliance
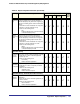
Infected
Malwares by
Day
For each email server protocol separately, the
number of detected virus or spyware infections or
infection attempts per day for the time range that you
specify in the Filtering Options section of the Reports
screen:
• Chart with the number of detected virus or spyware
infections or infection attempts per day
• Table with the following items:
- Day
- Number of detected virus or spyware infections
or infection attempts per day
Infected
Malwares by
Month
For each email server protocol separately, the
number of detected virus or spyware infections or
infection attempts per month for the time range that
you specify in the Filtering Options section of the
Reports screen:
• Chart with the number of detected virus or spyware
infections or infection attempts per month
• Table with the following items:
- Month
- Number of detected virus or spyware infections
or infection attempts per month
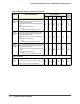
Application Activity
Top Blocked
Users by
Requests
Top users by number of blocked application requests:
• Chart with the number of blocked application
requests per user
• Table with the following items:
- User identity
- Number of blocked applications
Top Blocked
Applications
by Requests
Top blocked applications by number of requests:
• Chart with the number of requests per blocked
application
• Table with the following items:
- Application name
- Number of blocked requests
Application Activity, Advanced (Click +More onscreen)
Top Blocked
Clients by
Requests
Top clients IP addresses by number of blocked
applications:
• Chart with the number of blocked applications per
client IP address
• Table with the following items:
- Client IP address
- Number of blocked applications
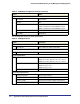
Table 63. Report Templates Information (Continued)
Activity Information Reported Filtering Options
Enable
logging
of HTTP
traffic
Client IP
Address
User Domain Web
Categories
Applications