
Quick Reference Guide

190 | Chapter 6. Monitoring System Access and Performance
ProSecure Web/Email Security Threat Management (STM) Appliance
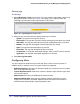
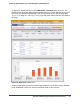
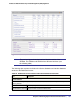
Monitoring Web Usage
The Web Usage screen shows you how the STM’s Web resources are being used. You can
see, for example, which host on the STM uses most resources.
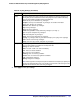
Total Malwares Found The total number of detected malware threats.
Virus The total number of detected viruses.
Spyware The total number of detected spyware threats.
Total Emails/Files Blocked The total number of blocked emails and files.
Total Malware Quarantined The total number of detected malware threats that were placed in quarantine.
Total Spam Quarantined The total number of spam messages that were placed in quarantine.
Note: These statistics apply only to SMTP.
Total URLs Blocked The total number of URL requests that were blocked.
Note: These statistics apply only to HTTP and HTTPS.
Total Spam Emails The total number of spam emails that were detected.
Note: These statistics apply only to SMTP and POP3.
Blacklist & RBL The total number of emails that were detected through the
spam blacklist and the real-time blacklist (see Setting Up the
Whitelist and Blacklist on page 98 and Configuring the
Real-Time Blacklist on page 100).
Distributed Spam
Analysis
The total number of spam messages that were detected
through distributed spam analysis (see Configuring Distributed
Spam Analysis on page 102).
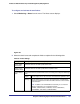
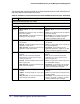
Interface Statistics
STM600: MGMT (Management), PAIR1 UPLINK, PAIR1 DOWNLINK, PAIR2 UPLINK, PAIR2 DOWNLINK.
STM300: MGMT, UPLINK, DOWNLINK.
STM150: LAN1, LAN2, LAN3, LAN4, WAN.
For each interface the following statistics are displayed:
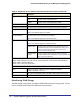
Status 10BaseT Half duplex, 10BaseT Full duplex, 100BaseT Half duplex,
100BaseT Full duplex, or No Link.
TX The number of transmitted packets in KB, MB, or GB (as stated on the screen).
RX The number of received packets in KB, MB, or GB (as stated on the screen).
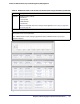
Table 56. Dashboard: Service Statistics and Interface Statistics Information (Continued)
Item Description