
Quick Reference Guide

Chapter 6. Monitoring System Access and Performance | 191
ProSecure Web/Email Security Threat Management (STM) Appliance
To view the STM’s Web usage:
1. Select Monitoring > Dashboard from the menu. The Dashboard submenu tabs display
with the Dashboard screen in view.
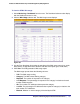
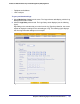
2. Click the Web Usage submenu tab. The Web Usage screen displays:
Figure 109.
3. Use the From drop-down list to select the start date of the Web usage report (year, month,
date) and the To drop-down list to select the end date of the report (year, month, date).
4. Click View. The STM generates a Web usage report.
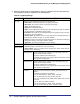
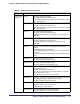
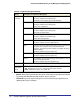
The Web usage reports shows the following columns:
• TOP. The Web usage ranking.
• Category. The Web content filtering category.
• Requests. The number of requests for the category.
• % of Requests. The percentage of requests for the category in relation to the total
number of Web requests.
• IPs. The number of IP addresses that request the category.
• % of IPs. The percentage of IP addresses that request the category in relation to the
total number of IP addresses.
• Blocked. Whether or not the category is blocked by the STM.