
User Manual
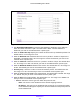
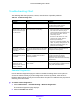
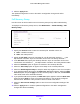
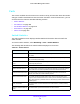
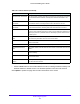

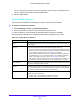
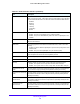
Table Of Contents
- S3300 Smart Managed Pro Switch
- Contents
- 1. Getting Started
- Getting Started with the NETGEAR Switch
- Switch Management Interface
- Connect the Switch to the Network
- Discover a Switch in a Network with a DHCP Server
- Discover a Switch in a Network without a DHCP Server
- Configure the Network Settings on the Administrative System
- Access the Management Interface from a Web Browser
- Understand the User Interfaces
- Interface Naming Convention
- Configuring Interface Settings
- Online Help
- Registration
- 2. Configure System Information
- 3. Configuring Switching
- 4. Configuring Routing
- 5. Configuring Quality of Service
- 6. Managing Device Security
- 7. Maintenance
- 8. Monitoring the System
- A. Configuration Examples
- B. Hardware Specifications and Default Values

Monitoring the System
318
S3300 Smart Managed Pro Switch
Port Statistics
The Port Statistics screen displays a summary of per-port traffic statistics on the switch.
To access the port summary screen:
1. Select Moni
toring > Ports > Port Statistics.
2. Select whe
ther to display physical interfaces, link aggregation groups (LAGs), or both by
clicking one of the following links above the table heading:
• 1 (or t
he unit ID of the switch). Only physical interfaces are displayed. This is the
default setting.
• LAGS. Only link a
ggregation groups are displayed.
• All. Both p
hysical interfaces and link aggregation groups are displayed.
To locate an interface quickly, type the interface number (for example, g1) in the Go To
Interf
ace field at the top or bottom of the table and click the Go button.
The following table describes the per-port st
atistics displayed on the screen.
Table 101. Port statistics
Field Description
Interface Lists the ports on the system.
Total Packets Received
Without Errors
The total number of packets received that were without errors.
Packets Received With Error The number of inbound packets that cont
ained errors preventing them from
being deliverable to a higher layer protocol.
Broadcast Packets Received The total number of good packets received that were directed to the broadcast
ad
dress. This does not include multicast packets.
Packets Transmitted Without
Errors
The number of frames that have been transmitted by this port to its segment.
Transmit Packet Errors The number of outbound packets that cou
ld not be transmitted because of
errors.
Collision Frames The best estimate of the total number of
collisions on this Ethernet segment.
Link Down Events The total number of link down events on a physical port.
Time Since Counters Last
Cleared
The elapsed time, in days, hours, minutes, and seconds since the statistics for
this port were last cleared.
To reset the counters for all interfaces on the switch:
1. Select the check box in the
heading of the table.
2. Click t
he Clear button.
To reset the counters for a specific interface:
1. Select the check box next
to the interface for which you want to clear the counters.