
Quick Reference Guide

Chapter 1: Overview | 29
NMS200 Quick Reference Manual
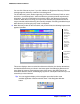
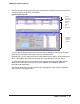
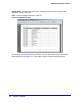
Tip: As in most such screens, you can sort the listed Alarms by clicking a
column header. Toggle the sort order by clicking the header again.
The Action Button or right-click menu displays the following items (some installations hide
some of these):
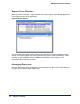
Open > Entity — This opens an editor where you can configure the device from which this
alarm came. See the NMS200 User Guide, or online help.
Open > Alarm — Opens a screen describing all the details of the selected alarm. See Alarm
Panels on page 28.
Open > Equipment — This opens an editor where you can configure the device from which
this alarm came (an Entity, if different, is a subcomponent of the equipment). See the
NMS200 User Guide, or online help for more about this.
Open > Event Definition — This opens an editor where you can reconfigure this alarm and
what it means. See the NMS200 User Guide or online help for more information.
Open > Processing Rules — This opens an editor where you can configure the processing
rules for this alarm. See the NMS200 User Guide or online help for more about these.
Acknowledge Alarm — Acknowledges the selected Alarm(s). The current date and time
appear in the Ack Time field, and the name of the currently logged-on user appears in the
Ack By field.
Unacknowledge Alarm — Unacknowledges previously acknowledged alarm(s), and clears
the entries in the Ack By and Ack Time fields.
Assign User — Assign this alarm to one of the users displayed in the sub-menu by selecting
that user.
Clear Alarm — Select this option to clear the alarm.
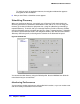
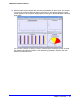
Show Performance — When you select this command the network management software
finds all of the performance attributes being monitored for the selected equipment and
creates a dashboard with one dashboard component for each attribute. (See Active
Performance Monitor in the NMS200 User Guide for details.)
If you multi-select more than one device, each component shows the top five metrics for each
attribute. If you select only one top-level device, The device's interface and port children are
searched for performance attributes and these attributes appear with the top five children for
each attribute.
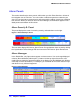
The data that appears is based on the monitors for thatthat device and where Retain Data is
checked. If you have several monitors and you are retaining data on those monitors, the
screen reflects those data points.
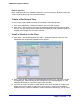
If you select two devices in Resources manager and click action > Show performance, Both
of the devices’ common attributes are displayed in the form. (You cannot display interface
data because the devices do not have interfaces in common.)
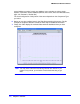
Map — Opens a topology view displaying the equipment from which the selected alarm(s)
came. See Mapping Equipment in the NMS200 User Guide or online help.