
Quick Reference Guide

Chapter 1: Overview | 23
NMS200 Quick Reference Manual
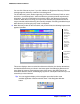
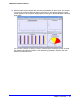
Default Monitors
Other, seeded monitors are available to add to the core set of monitors. By default, these are
active monitoring the group of all discovered entities.
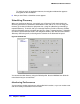
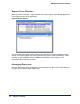
Create a Dashboard View
You can create custom dashboard views as described in the following steps:
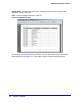
1. Click Active Monitoring > Dashboard Views to open the view manager.
2. Click action > New to create a new view. By default this appears with two rows and three
columns. You can change those numbers and click Update to create a different layout. For
simplicity, ther example has one column and row.
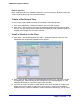
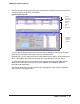
Install a Monitor in the View
3. Click action > Add Component then click Action > properties inside the view’s cell. The
Dashboard View Component Properties screen appears.
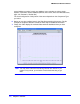
4. Enter a name for this component (TestDashboardComponent, here), and select a monitor
and display type. Notice also that for this example we leave Threshold Display as none
(displaying thresholds as a part of the graph is also possible).
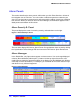
5. If you plan to monitor more than a single attribute, then select one entity to monitor at the
bottom of the screen (select an entity, then use the arrow to move it from Available to
Selected) and any number of attributes to monitor above that. Alternatively, you can select