
ProSafe Network Management System Reference Manual


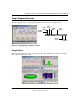

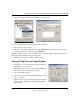


Table Of Contents
- Contents
- Chapter 1 Introduction
- Chapter 2 Installation and Startup
- Chapter 3 Data and Statistics
- Chapter 4 Polling and Emailing
- Chapter 5 Troubleshooting and Advanced Configuration
- Troubleshooting Network Discovery
- Duration of Network Discovery
- Normal Discovery Map Layout
- Failure Symptoms and Solutions
- Discovery Agent Fails to Connect to the Server
- Incorrect or Missing Community Names
- SNMP Device Access Control List
- Firewalls Block SNMP Operations
- Not Enough Seeds
- Broadcast Packet Losses
- Limiting the Scope of Discovery
- Setting Up New Filters
- Stopping Discovery Auto-Layout
- Troubleshooting Network Discovery
- Appendix A
- Glossary
- Index

Reference Manual for the ProSafe Network Management System NMS100
Data and Statistics 3-15
September 2004 202-10058-01
3. Select the Trend tab and open the Trend Reports Group name.
4. Use the right-click Insert Report menu to add a new report.
5. Enter a name for the new report.
6. Select one of the built-in table names from the MIB Table pull-down. You can also click the
>> button to select any standard or private MIB table.
Note: For initial test purposes, set the Poll Interval to one minute. We recommend that you use a
10 minute poll interval if you have several reports.
7. Click OK to save the report using standard settings.
Viewing Trend Data in a Graph Window
1. Assuming you set a one minute poll interval, wait about
10 minutes to save some data.
2. Right-click on the new report name in the Trend Report
Selection Tree and use the Properties menu.
3. Use the View Report menu.
4. Select the current day and Single Merged Graph to see all
data on one graph.
5. Click OK. Some progress dialogs are displayed and then
the report data is displayed in a regular ProSafe NMS
graph window.