
ProSafe Network Management System Reference Manual


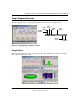

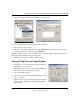


Table Of Contents
- Contents
- Chapter 1 Introduction
- Chapter 2 Installation and Startup
- Chapter 3 Data and Statistics
- Chapter 4 Polling and Emailing
- Chapter 5 Troubleshooting and Advanced Configuration
- Troubleshooting Network Discovery
- Duration of Network Discovery
- Normal Discovery Map Layout
- Failure Symptoms and Solutions
- Discovery Agent Fails to Connect to the Server
- Incorrect or Missing Community Names
- SNMP Device Access Control List
- Firewalls Block SNMP Operations
- Not Enough Seeds
- Broadcast Packet Losses
- Limiting the Scope of Discovery
- Setting Up New Filters
- Stopping Discovery Auto-Layout
- Troubleshooting Network Discovery
- Appendix A
- Glossary
- Index

Reference Manual for the ProSafe Network Management System NMS100
Data and Statistics 3-13
September 2004 202-10058-01
Graph Display Elements
The following figure shows a sample graph display and the function of graph controls.
Figure 3-4: Graph display and graph controls
Graph Styles
In the following figure there are four graph styles: Line, Bar, Distribution, and Pie. Note that the
Bar and Pie show Average values.
Graph
Save
Restart
Paging
Vertical
Poll
Graph
Style
to File
Controls
Scale
Interval
Pause
Graph