
User Manual
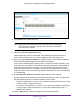

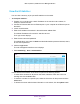
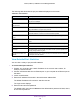
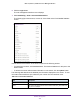

Table Of Contents
- M6100, M5300, and M7100 Series Managed Switches
- Contents
- 1. Getting Started
- 2. Configure System Information
- Initial Setup
- Configure a Management VLAN
- Configure the Initial Service Port Settings
- View or Define System Information
- View Backplane Information
- View the Temperature Sensor Information
- View the Fan Status
- View the Device Status
- View the System CPU Status
- Configure the CPU Thresholds
- View Switch Statistics
- View USB Device Information
- View Slot Information (M5300 only)
- Configure a Loopback Interface
- View the IPv6 Network Interface Neighbor Table
- Configure the IPv4 Service Port
- Configure the IPv6 Service Port
- IPv4 Management VLAN Overview
- Time
- Configure DNS Settings
- Configure Global DNS Settings
- Add a Static Entry to the Local DNS Table
- Configure the Switch Database Management Template Preference
- Configure Green Ethernet Settings
- Configure Green Ethernet Interface Settings
- Configure Green Ethernet Local and Remote Devices
- Configure Green Ethernet Remote Device Details
- View the Green Ethernet Statistics Summary
- Configure the Green Ethernet EEE LPI History
- Licenses (M5300 only)
- Configure DHCP Server Settings
- DHCP L2 Relay
- Configure Global DHCP L2 Relay Settings
- Configure a DHCP L2 Relay Interface
- View DHCP L2 Relay Interface Statistics
- Configure UDP Relay Global Settings
- Configure UDP Relay Interface Settings
- Enable or Disable DHCPv6 Server
- Configure the DHCPv6 Pool
- Configure the DHCPv6 Prefix Delegation
- Configure DHCPv6 Interface Settings
- View DHCPv6 Bindings Information
- View DHCPv6 Server Statistics
- Configure DHCPv6 Relay for an Interface
- Configure Basic PoE
- Configure SNMP
- LLDP Overview
- Configure LLDP Global Settings
- Configure the LLDP Interface
- View LLDP Statistics
- View LLDP Local Device Information
- View LLDP Remote Device Information
- View LLDP Remote Device Inventory
- Configure LLDP-MED Global Settings
- Configure LLDP-MED Interface
- View LLDP-MED Local Device Information
- View LLDP-MED Remote Device Information
- View LLDP-MED Remote Device Inventory
- Configure ISDP
- Timer Schedule
- Initial Setup
- 3. Chassis and Stacking
- M6100 Series Switch Chassis Overview
- Configure Basic Chassis Settings
- View the Chassis Protocol Information
- View Chassis Backplane-Port Configuration
- View the Chassis Backplane-Port Packet-Path
- Configure the Chassis Power Settings
- Configure the System Power
- Configure the Power Auto-Rebalance
- View Blade Power Consumption
- View Power Redundancy
- View the Power Modules
- View EPS Power Modules and EPS Ports
- View the Power Matrix
- Rebalance the Chassis Power
- Configure Chassis Firmware Synchronization
- View NSF Summary Data
- View NSF Checkpoint Statistics
- M5300 Series Switch Stacking Overview
- Stack Configuration
- M6100 Series Switch Chassis Overview
- 4. Configure Switching Information
- Configure VLANs
- Configure Basic VLAN Settings
- Configure an Advanced VLAN
- Configure an Internal VLAN
- Configure VLAN Trunking
- Configure VLAN Membership
- View VLAN Status
- Configure Port PVID Settings
- Configure a MAC-Based VLAN
- Configure Protocol-Based VLAN Groups
- Configure Protocol-Based VLAN Group Membership
- Configure an IP Subnet-Based VLAN
- Configure a Port DVLAN
- Configure a Voice VLAN
- Configure GARP Switch Settings
- Configure GARP Port
- Auto-VoIP
- iSCSI Overview
- Spanning Tree Protocol
- Multicast
- View the MFDB Table
- View the MFDB Statistics
- IGMP Snooping
- Configure IGMP Snooping
- Configure IGMP Snooping for Interfaces
- Configure IGMP Snooping for VLANs
- Configure a Multicast Router
- Configure a Multicast Router VLAN
- IGMP Snooping Querier Overview
- Configure IGMP Snooping Querier
- Configure IGMP Snooping Querier for VLANs
- Configure MLD Snooping
- Configure a MLD Snooping Interface
- Configure MLD VLAN Settings
- Enable or Disable a Multicast Router on an Interface
- Configure Multicast Router VLAN Settings
- Configure MLD Snooping Querier
- Configure MLD Snooping Querier VLAN Settings
- Configure MVR
- MAC Address Table
- Port Settings
- Link Aggregation Groups
- Configure LAG Settings
- Configure LAG Membership
- Configure the Virtual Port-Channel Global Settings
- Configure the Keep-Alive Parameters
- View the VPC Peer Link Settings
- Configure the Peer Link Settings
- Configure the Peer Detection Settings
- Configure the Virtual Port Channel Interface
- View Virtual Port Channel Interface Details
- View Virtual Port Channel Interface Details
- View Virtual Port Channel Keep-Alive Statistics
- View Virtual Port Channel Peer Link Statistics
- Multiple Registration Protocol Overview
- Configure VLANs
- 5. Routing
- 6. OSPF and OSPFv3
- OSPF
- Configure Basic OSPF Settings
- Configure the OSPF Default Route Advertise Settings
- Configure OSPF Settings
- Configure the OSPF Common Area ID
- Configure the OSPF Stub Area
- Configure the OSPF NSSA Area
- Configure the OSPF Area Range
- Configure the OSPF Interface
- View OSPF Statistics for an Interface
- View the OSPF Neighbor Table
- View the OSPF Link State Database
- Configure the OSPF Virtual Link
- Configure the OSPF Route Redistribution
- View the NSF OSPF Summary
- OSPFv3
- Configure Basic OSPFv3 Settings
- Configure OSPFv3 Default Route Advertise Settings
- Configure the Advanced OSPFv3 Settings
- Configure the OSPFv3 Common Area
- Configure an OSPFv3 Stub Area
- Configure the OSPFv3 NSSA Area
- Configure the OSPFv3 Area Range
- Configure the OSPFv3 Interface
- View OSPFv3 Interface Statistics
- View the OSPFv3 Neighbor Table
- View the OSPFv3 Link State Database
- Configure the OSPFv3 Virtual Link
- Configure OSPFv3 Route Redistribution
- View the NSF OSPFv3 Summary
- OSPF
- 7. Multicast Routing
- Multicast Overview
- Configure Multicast IGMP Settings
- Configure PIM Settings
- Configure the Multicast PIM Global Settings
- Configure PIM SSM Settings
- Configure PIM Interface
- View the PIM Neighbor
- View the PIM Candidate Rendezvous Point
- View the PIM Neighbor
- Configure the PIM Candidate Rendezvous Point
- Configure the PIM Bootstrap Router Candidate
- Configure the PIM Static Rendezvous Point
- Configure Multicast Static Routes
- Configure the Multicast Admin Boundary
- Configure IPv6 Multicast Settings
- View the IPv6 Multicast Mroute Table
- Configure the IPv6 PIM Global Settings
- Configure IPv6 PIM SSM
- Configure the IPv6 PIM Interface
- View the IPv6 PIM Neighbor
- Configure the IPv6 PIM Candidate Rendezvous Point
- Configure the IPv6 PIM Bootstrap Router Candidate Settings
- Configure the IPv6 PIM Static Rendezvous Point
- Configure IPv6 MLD Global Settings
- Configure the IPv6 MLD Routing Interface
- View IPv6 MLD Routing Interface Statistics
- View the IPv6 MLD Groups
- View IPv6 MLD Traffic
- Configure the IPv6 MLD Proxy Interface
- View IPv6 MLD Proxy Interface Statistics
- View the IPv6 MLD Proxy Membership
- Configure IPv6 Multicast Static Routes
- 8. Configure Quality of Service
- 9. Manage Device Security
- Management Security Settings
- TACACS Overview
- Configure Management Access
- Configure HTTP Server Settings
- HTTPS Configuration
- Manage Certificates
- Download Certificates
- Configure SSH Settings
- Manage Host Keys
- Download Host Keys
- Configure Telnet Settings
- Configure the Telnet Authentication List
- Configure the Console Port
- Configure Denial of Service Settings
- Configure an Access Control Profile
- Configure Access Rule Settings
- Port Authentication
- Traffic Control
- Port Security
- Configure the Global Port Security Mode
- Configure a Port Security Interface
- Convert Learned MAC Addresses to Static Addresses
- Configure a Static MAC Address
- Configure a Private Group
- Configure Private Group Membership
- Configure Protected Ports
- Configure a Private VLAN
- Configure Private VLAN Association Settings
- Configure the Private VLAN Port Mode
- Configure a Private VLAN Host Interface
- Configure a Private VLAN Promiscuous Interface
- Storm Control
- Configure Global Storm Control Settings
- Configure a Storm Control Interface
- DHCP Snooping
- Configure DHCP Snooping Global Settings
- Configure a DHCP Snooping Interface
- Configure DHCP Snooping Binding
- Configure Snooping Persistent Settings
- View DHCP Snooping Statistics
- Configure an IP Source Guard Interface
- Configure IP Source Guard Binding Settings
- Configure IPv6 Source Guard Interface Settings
- Configure IPv6 Source Guard Binding
- Configure Dynamic ARP Inspection
- Configure a DAI VLAN
- Configure the DAI Interface
- Configure a DAI ACL
- Configure a DAI ACL Rule
- View DAI Statistics
- Captive Portal
- Configure Captive Portal Global Settings
- Add a Captive Portal Instance
- Configure CP Binding
- View the Captive Portal Binding Table
- Configure a Captive Portal Group
- Configure Captive Portal User Settings
- Configure the Captive Portal Trap Flag Settings
- View the Captive Portal Client
- Configure Access Control Lists
- Use the ACL Wizard to Create a Simple ACL
- Configure an ACL Based on Destination MAC Address
- Use the ACL Wizard to Complete the Destination MAC ACL
- Configure a Basic MAC ACL
- Configure MAC ACL Rules
- Configure MAC Binding
- View or Delete MAC ACL Bindings in the MAC Binding Table
- Configure an IP ACL
- Configure Rules for an IP ACL
- Configure Rules for an Extended IP ACL
- Configure IPv6 ACL
- Configure IPv6 Rules
- Configure IP ACL Interface Bindings
- View or Delete IP ACL Bindings in the IP ACL Binding Table
- View or Delete VLAN ACL Bindings in the VLAN Binding Table
- 10. Monitor the System
- 11. Maintenance
- A. Default Settings
- B. Configuration Examples
- C. Acronyms and Abbreviations

Monitor the System
679
M6100, M5300, and M7100 Series Managed Switches
6. Click the Login button.
The web management interface menu displays.
7. Select Monitoring > Ports > Port Detailed Statistics.
The following figure shows some, but not all, of the fields on the Port Detailed Statistics
screen.
Use the buttons at the bottom of the screen to perform the following actions:
• To clear all the counters, click the Clear button. This resets all statistics for this port to the
default values.
• To refresh the screen with the latest information on the switch, click the Update button.
The following table describes the detailed port information displayed on the screen. To view
information about a different port, select the port number from the Interface menu.
Table 239. Port Detailed Statistics
Field Description
MST ID Display the MST instances associated with the interface.
ifIndex This object indicates the ifIndex of the interface table entry associated with
this port on an adapter.