
User Manual


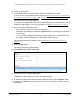

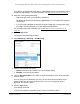
Table Of Contents
- 24-Port Gigabit (Hi-Power) PoE+ Ethernet Smart Managed Pro Switch with 2 SFP Ports and Cloud Management
- Contents
- 1 Get Started
- Available publications
- Switch management options and default management mode
- Manage the switch by using the local browser UI
- About on-network and off-network access
- Access the switch on-network and connected to the Internet
- Use a Windows-based computer to access the switch on-network
- Use the NETGEAR Insight mobile app to discover the IP address of the switch
- Use the NETGEAR Switch Discovery Tool to discover the switch
- Discover the switch in a network with a DHCP server using the Smart Control Center
- Discover the switch in a network without a DHCP server using the Smart Control Center
- Use other options to discover the switch IP address
- Access the switch on-network when you know the switch IP address
- Access the switch off-network
- Credentials for the local browser UI
- Register the switch
- Change the language of the local browser UI
- Change the management mode of the switch
- Use the Device View of the local browser UI
- Configure interface settings
- Access the NETGEAR support website
- Access the user manual online
- 2 Configure System Information
- View or define switch system information
- Configure the switch IP address settings
- Configure the IPv6 network interface
- Configure the time settings
- Configure Denial of Service settings
- Configure the DNS settings
- Configure Green Ethernet settings
- Use the Device View
- Configure Power over Ethernet
- Configure SNMP
- Configure LLDP
- Configure DHCP snooping
- Set up PoE timer schedules
- 3 Configure Switching
- Configure the port settings and maximum frame size
- Configure link aggregation groups
- Configure VLANs
- Configure a voice VLAN
- Configure Auto-VoIP
- Configure Spanning Tree Protocol
- Configure multicast
- Manage IGMP snooping
- Configure IGMP snooping
- Configure IGMP snooping for interfaces
- View, search, or clear the IGMP snooping table
- Configure IGMP snooping for VLANs
- Modify IGMP snooping settings for a VLAN
- Disable IGMP snooping on a VLAN
- Configure one or more IGMP multicast router interfaces
- Configure an IGMP multicast router VLAN
- IGMP snooping querier overview
- Configure an IGMP snooping querier
- Configure an IGMP snooping querier for a VLAN
- Display the status of the IGMP snooping querier for VLANs
- View, search, and manage the MAC address table
- Configure Layer 2 loop protection
- 4 Configure Quality of Service
- 5 Manage Device Security
- Change the local device password for the local browser UI
- Manage the RADIUS settings
- Configure the TACACS+ settings
- Manage the Smart Control Center Utility
- Configure management access
- Control access with profiles and rules
- Configure port authentication
- Set up traffic control
- Configure access control lists
- Use the ACL Wizard to create a simple ACL
- Configure a MAC ACL
- Configure MAC ACL rules
- Configure MAC bindings
- View or delete MAC ACL bindings in the MAC binding table
- Configure a basic or extended IPv4 ACL
- Configure rules for a basic IPv4 ACL
- Configure rules for an extended IPv4 ACL
- Configure an IPv6 ACL
- Configure rules for an IPv6 ACL
- Configure IP ACL interface bindings
- View or delete IP ACL bindings in the IP ACL binding table
- Configure VLAN ACL bindings
- 6 Monitor the System
- 7 Maintain or Troubleshoot the Switch
- A Configuration Examples
- B Specifications and Default Settings

24-Port Gigabit (Hi-Power) PoE+ Ethernet Smart Managed Pro Switch with 2 SFP Ports
Monitor the System User Manual375
• If you previously managed the switch through the Insight app or Cloud portal, enter
the Insight network password for the last Insight network location.
For information about the credentials, see Credentials for the local browser UI on
page 30.
5. Click the Login
button.
The System Information page displays.
6. Select Monitoring >
Logs > Server Log.
The Server Log page displays.
7. In the Server Log Configuration section, select one of the following Admin Status radio
buttons:
•
Enable.
Send
log messages to all configured hosts (syslog collectors or relays) using
the values configured for each host.
• Disable. Stop logging to all syslog hosts. Disable means no messages are sent to
any collector or relay.
8. Click the Apply
button.
Your settings are saved.
9. In the Server Configuration section, specify the following settings:
•
IP Address Type. Specify the IP address type of the host, which can be IPv4, IPv6,
or DNS.
• Host Address. Specify the IP address or host name of the syslog host.
• Port. Specify the port on the host to which syslog messages must be sent. The
default port number is 514.
•
Severity Filter. Use the menu to select the severity of the logs that must be sent to
the logging host. Logs with the selected severity level and all logs of greater severity
are sent to the host. For example, if you select Error, the logged messages include
Error
, Critical,
Alert, and Emergency. The severity can be one of the following levels:
- Emergency (0). The highest warning level. If the device is down or not
functioning properly
, an emergency log is saved to the device.
- Alert (1). The second-highest warning level.
An alert log is saved if a serious
device malfunction occurs, such as all device features being down.
- Critical (2). The third-highest warning level.
A critical log is saved if a critical
device malfunction occurs, for example, two device ports are not functioning,
while the rest of the device ports remain functional.
- Error (3). A device error occurred, such as a port being of
fline.
- Warning (4). The lowest level of a device warning.
-
Notice (5). Provides the network administrators with device information.
- Informational (6). Provides device information.
- Debug (7). Provides detailed information about the log.