
User Manual


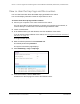

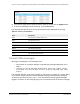


Table Of Contents
- 8-Port or 16-Port Gigabit Smart Managed Pro Switch with PoE+ and 2 SFP Ports
- Contents
- 1 Get Started
- Available publications
- Switch management and discovery overview
- Change the default IP address of the switch
- Discover or change the switch IP address
- About the user interfaces
- Access the local browser interface
- Change the language of the local browser interface
- Use the Device View of the local browser interface
- Interface naming conventions
- Configure interface settings
- Context–sensitive help and access to the support website
- Access the user manual online
- Register your product
- 2 Configure System Information
- View or define system information
- Configure the IP network settings for management access
- Configure the time settings
- Configure denial of service settings
- Configure the DNS settings
- Configure green Ethernet settings
- Use the Device View
- Configure Power over Ethernet
- Configure SNMP
- Configure LLDP
- Configure a DHCP L2 relay, DHCP snooping, and dynamic ARP inspection
- Set up PoE timer schedules
- 3 Configure Switching
- Configure the port settings
- Configure link aggregation groups
- Configure VLANs
- Configure a voice VLAN
- Configure Auto-VoIP
- Configure Spanning Tree Protocol
- Configure multicast
- Manage IGMP snooping
- Configure IGMP snooping
- Configure IGMP snooping for interfaces
- View, search, or clear the IGMP snooping table
- Configure IGMP snooping for VLANs
- Modify IGMP snooping settings for a VLAN
- Disable IGMP snooping on a VLAN and remove it from the table
- Configure one or more IGMP multicast router interfaces
- Configure an IGMP multicast router VLAN
- IGMP snooping querier overview
- Configure an IGMP snooping querier
- Configure an IGMP snooping querier for a VLAN
- Display the status of the IGMP snooping querier for VLANs
- Manage MLD snooping
- Enable MLD snooping
- Configure MLD snooping for interfaces
- Configure the MLD VLAN settings
- Modify the MLD snooping settings for a VLAN
- Remove MLD snooping from a VLAN
- Configure one or more MLD multicast router interfaces
- Configure an MLD multicast router VLAN
- Configure an MLD snooping querier
- Configure the MLD snooping querier VLAN settings
- Configure multicast VLAN registration
- View, search, and manage the MAC address table
- Configure Layer 2 loop protection
- 4 Configure Routing
- 5 Configure Quality of Service
- 6 Manage Device Security
- Change the device password for the local browser interface
- Manage the RADIUS settings
- Configure the TACACS+ settings
- Configure authentication lists
- Manage the Smart Control Center Utility
- Configure management access
- Control access with profiles and rules
- Configure port authentication
- Set up traffic control
- Configure access control lists
- Use the ACL Wizard to create a simple ACL
- Configure a MAC ACL
- Configure MAC ACL rules
- Configure MAC bindings
- View or delete MAC ACL bindings in the MAC binding table
- Configure a basic or extended IPv4 ACL
- Configure rules for a basic IPv4 ACL
- Configure rules for an extended IPv4 ACL
- Configure an IPv6 ACL
- Configure rules for an IPv6 ACL
- Configure IP ACL interface bindings
- View or delete IP ACL bindings in the IP ACL binding table
- Configure VLAN ACL bindings
- 7 Monitor the Switch and the Traffic
- 8 Maintain or Troubleshoot the Switch
- A Configuration Examples
- B Specifications and Default Settings

8-Port or 16-Port Gigabit Smart Managed Pro Switch Model GS418TPP, GS510TLP, and GS510TPP
Monitor the Switch and the Traffic User Manual413
• Severity Filter. Use the menu to select the severity of the logs that must be sent to
the logging host. Logs with the selected severity level and all logs of greater severity
are sent to the host. For example, if you select Error, the logged messages include
Error, Critical, Alert, and Emergency. The default severity level is Alert (1). The
severity can be one of the following levels:
- Emergency (0).
The highest warning level. If the device is down or not
functioning properly
, an emergency log is saved to the device.
- Alert (1). The second-highest warning level.
An alert log is saved if a serious
device malfunction occurs, such as all device features being down.
- Critical (2). The third-highest warning level.
A critical log is saved if a critical
device malfunction occurs, for example, two device ports are not functioning,
while the rest of the device ports remain functional.
- Error (3).
A device error occurred, such as a port being of
fline.
- Warning (4). The lowest level of a device warning.
-
Notice (5). Provides the network administrators with device information.
- Informational (6). Provides device information.
- Debug (7). Provides detailed information about the log.
10. Click the Add button.
The remote syslog host is added.
The Status field in the Server Configuration table shows whether the remote logging host
is currently active.
The Server Log Configuration section displays the following information:
• The Messages Received field shows the number of messages received by the log
process.
This includes messages that are dropped or ignored.
• The Messages Relayed
field shows the number of messages forwarded by the
syslog function to a syslog host. Messages forwarded to multiple hosts are counted
once for each host.
• The Messages Ignored field shows the number of messages that were ignored.
Modify the settings for a remote syslog host
To modify the settings for a remote syslog host:
1. Connect your computer to the same network as the switch.
You can use a WiFi or wired connection to connect your computer to the network, or
connect directly to a switch that is off-network using an Ethernet cable.
2. Launch a web browser.
3. In the address field of your web browser, enter the IP address of the switch.
If you do not know the IP address of the switch, see
Change the default IP address of
the switch on page 13.
The login window opens.