
User Manual
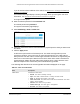

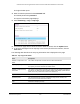
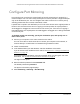
Table Of Contents
- S350 Series 8-Port Gigabit Ethernet Smart Switch
- Contents
- 1 Get Started
- Available Publications
- Switch Management and Discovery Overview
- Options to Change the Default IP Address of the Switch
- Discover or Change the Switch IP Address
- About the User Interfaces
- Access the Local Browser Interface
- Change the Language of the Local Browser Interface
- Use the Device View of the Local Browser Interface
- Interface Naming Conventions
- Configure Interface Settings
- Context-Sensitive Help and Access to the Support WebSite
- Access the User Guide Online
- Register Your Product
- 2 Configure System Information
- 3 Configure Switching
- Configure the Port Settings and Maximum Frame Size
- Configure Link Aggregation Groups
- Configure VLANs
- Configure a Voice VLAN
- Configure Auto-VoIP
- Configure Spanning Tree Protocol
- Configure Multicast
- View and Search the MFDB Table
- View the MFDB Statistics
- Configure the Auto-Video Multicast Settings
- About IGMP Snooping
- Configure IGMP Snooping
- Configure IGMP Snooping for Interfaces
- View, Search, or Clear the IGMP Snooping Table
- Configure IGMP Snooping for VLANs
- Modify IGMP Snooping Settings for a VLAN
- Disable IGMP Snooping on a VLAN
- Configure a Multicast Router Interface
- Configure a Multicast Router VLAN
- IGMP Snooping Querier Overview
- Configure an IGMP Snooping Querier
- Configure an IGMP Snooping Querier for VLANs
- Display IGMP Snooping Querier for VLAN Status
- View, Search, and Manage the MAC Address Table
- Configure Layer 2 Loop Protection
- 4 Configure Quality of Service
- 5 Manage Device Security
- Configure the Management Security Settings
- Configure Management Access
- Configure Port Authentication
- Set Up Traffic Control
- Configure Access Control Lists
- Use the ACL Wizard to Create a Simple ACL
- Configure a Basic MAC ACL
- Configure MAC ACL Rules
- Configure MAC Bindings
- View or Delete MAC ACL Bindings in the MAC Binding Table
- Configure a Basic or Extended IP ACL
- Configure Rules for a Basic IP ACL
- Configure Rules for an Extended IP ACL
- Configure IP ACL Interface Bindings
- View or Delete IP ACL Bindings in the IP ACL Binding Table
- Configure VLAN ACL Bindings
- 6 Monitor the System
- 7 Maintenance
- A Configuration Examples
- B Specifications and Default Settings

S350 Series 8-Port Gigabit Ethernet Smart Switch Models GS308T and GS310TP
Monitor the System User Manual306
2. Launch a web browser.
3. In the address field of your web browser
, enter the IP address of the switch.
If you do not know the IP address of the switch, see
Discover or Change the Switch IP
Address on page 12.
Your web browser might display a security message, which you can ignore. For more
information, see Access the Local Browser Interface on page 18.
The login window opens.
4. Enter the switch’
s password in the Password field.
The default password is password.
The System Information page displays.
5. Select Monitoring > Logs > Server Log.
The Server Log page displays.
6. In the Server Log Configuration section, select one of the following
Admin Status radio
buttons:
• Enable. Send log messages to all configured hosts (syslog collectors or relays) using
the values configured for each host.
• Disable. Stop logging to all syslog hosts. Disable means no messages are sent to
any collector or relay
.
7. Click the Apply button.
Your settings are saved.
8. In the Server Configuration section, specify the following settings:
• IP Address Type. Specify the IP address type of the host, which can be IPv4 or DNS.
• Host Address. Specify the IP address or host name of the syslog host.
• Port. Specify the port on the host to which syslog messages must be sent.
The
default port number is 514.
• Severity Filter. Use the menu to select the severity of the logs that must be sent to
the logging host. Logs with the selected severity level and all logs of greater severity
are sent to the host. For example, if you select Error, the logged messages include
Error
, Critical, Alert, and Emergency. The default severity level is Alert (1). The
severity can be one of the following levels:
- Emergency (0).
The highest warning level. If the device is down or not functioning
properly, an emergency log is saved to the device.
- Alert (1).
The second-highest warning level. An alert log is saved if a serious
device malfunction occurs, such as all device features being down.
- Critical (2).
The third-highest warning level. A critical log is saved if a critical
device malfunction occurs, for example, two device ports are not functioning,
while the rest of the device ports remain functional.
- Error (3).
A device error occurred, such as a port being offline.