
Manual
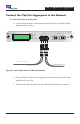
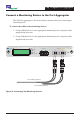


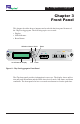


iTap 10 GigaBit Port Aggregator
24
Display
The front panel of the iTap provides port trafc information on a 2x16 character
LCD display. After a boot up message, the display scrolls through the following
four screens.
• Two screens show the Network and Monitor Port current and peak utilizations,
and are displayed for 10 seconds each.
• The other two screens show the times of the peak utilizations, and are displayed
for 5 seconds each.
• On each screen, the top line shows one port and the bottom line shows another.
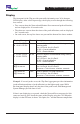
Display Message Time Description
A XX.X% PP.P%
B XX.X% PP.P%
10 sec Percent of Network Port bandwidth being used by
incoming trafc
Line 1 is Port A; line 2 is Port B
XX.X% = Current utilization
PP.P% = Peak utilization
1 XX.X% PP.P%
2 XX.X% PP.P%
10 sec Percent of Monitor Port bandwidth being used by
outgoing trafc
Line 1 is Port 1; line 2 is Port 2
XX.X% = Current utilization
PP.P% = Peak utilization
A@ hh:mm:ss
B@ hh:mm:ss
5 sec Times of Network Port peak utilizations
Line 1 is Port A; line 2 is Port B
hh:mm:ss = Time in hours : minutes : seconds
1@ hh:mm:ss
2@ hh:mm:ss
5 sec Times of Monitor Port peak utilizations
Line 1 is Port 1; line 2 is Port 2
hh:mm:ss = Time in hours : minutes : seconds
Example: If several peaks occur, the iTap Port Aggregator provides information
(peak utilization and time of peak utilization) on the highest peak event. While
the front panel display shows only the time of the peak events, Web Manager and
System Manager provide dates as well.
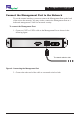
If data is not displaying as expected, check the Network Port connectors for link
status and activity. Also check the status of the Display using the CLI. When the
display is in the OFF state, it shows "Net Optics, Inc." and the rmware compile date.