
Instruction Manual

Chapter 7: Monitoring and Debugging Pointe Controller User Guide
194
7.1 Monitoring a Running Project
After you have loaded and started a project on your Pointe Controller unit, you
can monitor the project’s behavior using the tools included in PCM. These tools
are accessible through the four tabbed panes along the bottom of the PCM
window:
The Charts tab lists all of the Flow Charts and Ladder Diagrams that are
running in the current project. You can select any listed chart to open it
for viewing and/or debugging.
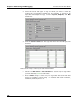
The Browser tab provides a searchable list of all the Logic Memory tags,
strings, and timers in the current project. You can select individual tags to
see their real-time values or to force new values.
The Console tab displays all status and error messages generated by PCM
itself as it communicates with attached controllers.
The Controller Log tab shows the activity log of the currently attached
controller. Logged activities include project loads and unloads, project
starts and stops, and password group changes.
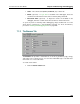
You can also check the general system performance (scanning speed, processor
usage, I/O errors) of the Pointe Controller itself by using the Performance Metrics
window.
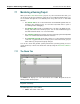
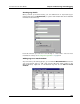
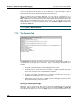
7.1.1 The Charts Tab
The Charts tab displays all of the Flow Charts and Ladder Diagrams that are
running in the current project.
NOTE: In this chapter, the term “charts” refers to both Flow Charts and Ladder
Diagrams collectively.
The tab displays up to four columns:
Chart – The name of the chart.