
user manual


EliteMail VMS/EliteMail Limited Issue 3
Reference 16 - 3
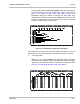
The bar graph report for the entire system shows the percentage of
each hour that the voice mail system ports were in use. Refer to
Figure 16-3 Sample System Usage Bar Graph Report. This
percentage equals the number of minutes the ports were busy,
divided by the number of minutes they could have been busy. The
number of minutes they could have been busy equals 60 minutes
times the number of ports on the system.
Figure 16-3 Sample System Usage Bar Graph Report
This report tells you when the voice mail system is busiest, so you can
decide when you need to add ports to the system to answer more calls.
The Usage Table
When you run the usage table for an individual guest, subscriber,
Extension # ID, or System ID, the report totals the number of calls by
system port, and totals the number of minutes the calls lasted. Refer
to Figure 16-4 Sample Subscriber Usage Table Report.
Figure 16-4 Sample Subscriber Usage Table Report