IMAQ ™ IMAQ Vision for Measurement Studio™ User Manual LabWindows/CVI IMAQ Vision for LabWindows/CVI User Manual May 2001 Edition Part Number 323022A-01
Support Worldwide Technical Support and Product Information ni.
Important Information Warranty The media on which you receive National Instruments software are warranted not to fail to execute programming instructions, due to defects in materials and workmanship, for a period of 90 days from date of shipment, as evidenced by receipts or other documentation. National Instruments will, at its option, repair or replace software media that do not execute programming instructions if National Instruments receives notice of such defects during the warranty period.
Conventions The following conventions are used in this manual: » The » symbol leads you through nested menu items and dialog box options to a final action. The sequence File»Page Setup»Options directs you to pull down the File menu, select the Page Setup item, and select Options from the last dialog box. This icon denotes a note, which alerts you to important information. bold Bold text denotes items that you must select or click on in the software, such as menu items and dialog box options.
Contents Chapter 1 Introduction to IMAQ Vision About IMAQ Vision ......................................................................................................1-1 Documentation and Examples .......................................................................................1-1 Application Development Environments.......................................................................1-2 IMAQ Vision Function Tree.......................................................................................
Contents Measure Color Statistics................................................................................................ 3-7 Comparing Colors ........................................................................................... 3-8 Learning Color Information ............................................................................ 3-9 Choosing the Right Color Information ............................................. 3-9 Specifying the Color Information to Learn ...........................
Contents Training the Color Pattern Matching Algorithm...............................5-20 Defining a Search Area .....................................................................5-21 Setting Matching Parameters and Tolerances...................................5-22 Testing the Search Algorithm on Test Images..................................5-24 Finding Points Using Color Location..............................................................5-25 Convert Pixel Coordinates to Real-World Coordinates.......
Introduction to IMAQ Vision 1 This chapter describes the IMAQ Vision for LabWindows/CVI software and associated software products, discusses the documentation and examples available, outlines the IMAQ Vision function organization, and lists the steps for making a machine vision application. For information about the system requirements and installation procedure for IMAQ Vision for LabWindows/CVI, see the IMAQ Vision for Measurement Studio Release Notes that came with your software.
Chapter 1 Introduction to IMAQ Vision Documentation»IMAQ Vision for LabWindows/CVI Function Reference. • Example programs—If you want examples of how to create specific applications, go to cvi\samples\vision. • Application Notes—If you want to know more about advanced IMAQ Vision concepts and applications, refer to the Application Notes located on the National Instruments Web site at ni.com/appnotes.
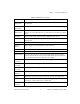
Chapter 1 Introduction to IMAQ Vision Table 1-1. IMAQ Vision Function Types Function Type Description Image Management Functions that create space in memory for images and perform basic image manipulation. Memory Management A function that returns memory you no longer need to the operating system. Error Management Functions that set the current error, return the name of the function in which the last error occurred, return the error code of the last error, and clear any pending errors.
Chapter 1 Introduction to IMAQ Vision Table 1-1. IMAQ Vision Function Types (Continued) Function Type Description Frequency Domain Analysis Functions for the extraction and manipulation of complex planes. Functions of this type perform FFTs, inverse FFTs, truncation, attenuation, addition, subtraction, multiplication, and division of complex images. Barcode A function that reads a barcode. LCD Functions that find and read seven-segment LCD characters.
Chapter 1 Introduction to IMAQ Vision Creating IMAQ Vision Applications Figures 1-1 and 1-2 illustrate the steps for creating an application with IMAQ Vision. Figure 1-1 describes the general steps to designing a Vision application. The last step in Figure 1-1 is expanded upon in Figure 1-2. You can use a combination of the items in the last step to create your IMAQ Vision application. For more information about items in either diagram, see the corresponding chapter listed to the right of the item.
Chapter 1 Introduction to IMAQ Vision 1 Define Regions of Interest Chapter 3: Grayscale and Color Measurements Chapter 4: Blob Analysis Measure Grayscale Statistics Measure Color Statistics 2 3 Correct Image Distortion Locate Objects to Inspect Create a Binary Image Set Search Areas Improve a Binary Image Find Measurement Points Make Particle Measurements Convert Pixel Coordinates to Real-World Coordinates Convert Pixel Coordinates to Real-World Coordinates Make Measurements Chapter 5: Ma
Getting Measurement-Ready Images 2 This chapter describes how to set up your imaging system, acquire and display an image, analyze the image, and prepare the image for additional processing. Set Up Your Imaging System Before you acquire, analyze, and process images, you must set up your imaging system. The manner in which you set up your system depends on your imaging environment and the type of analysis and processing you need to do.
Chapter 2 Getting Measurement-Ready Images 3. Select an image acquisition device that meets your needs. National Instruments offers several image acquisition (IMAQ) devices, such as analog color and monochrome IMAQ devices as well as digital devices. Visit ni.com/imaq for more information about IMAQ devices. 4. Configure the driver software for your image acquisition device.
Chapter 2 Getting Measurement-Ready Images Table 2-1.
Chapter 2 Getting Measurement-Ready Images Source and Destination Images Some IMAQ Vision functions that modify the contents of an image have source image and destination image input parameters. The source image receives the image to process. The destination image receives the processing results. The destination image can receive either another image or the original, depending on your goals. If you do not want the contents of the original image to change, use separate source and destination images.
Chapter 2 • Getting Measurement-Ready Images imaqAdd(myImageA, myImageA, myImageB); This function adds two source images and stores the result in the first source image. • imaqAdd(myImageB, myImageA, myImageB); This function adds two source images and stores the result in the second source image. Most operations between two images require that the images have the same type and size. However, some arithmetic operations can work between two different types of images (for example, 8-bit and 16-bit).
Chapter 2 Getting Measurement-Ready Images Acquiring an Image Use one of the following methods to acquire images with a National Instruments image acquisition (IMAQ) device: • Acquire a single image using imaqEasyAcquire(). When you call this function, it initializes the IMAQ device and acquires the next incoming video frame. Use this function for low-speed single capture applications where ease of programming is essential. • Acquire a single image using imaqSnap().
Chapter 2 Getting Measurement-Ready Images Use imaqReadVisionFile() to open an image file containing additional information, such as calibration information, template information for pattern matching, or overlay information. For more information about pattern matching templates and overlays, see Chapter 5, Machine Vision. You can also use imaqGetFileInfo() to retrieve image properties—image size, recommended image type, and calibration units—without actually reading all the image data.
Chapter 2 Getting Measurement-Ready Images Attach Calibration Information If you want to attach the calibration information of the current setup to each image you acquire, use imaqCopyCalibrationInfo(). This function takes in a source image containing the calibration information and a destination image that you want to calibrate. The output image is your inspection image with the calibration information attached to it. For detailed information about calibration, see Chapter 6, Calibration.
Chapter 2 Getting Measurement-Ready Images this range in processing functions, such as determining a threshold range during blob analysis. If the image quality does not meet your needs, try to improve the imaging conditions to get the desired image quality. You may need to re-evaluate and modify each component of your imaging setup: lighting equipment and setup, lens tuning, camera operation mode, and acquisition board parameters.
Chapter 2 Getting Measurement-Ready Images transformations. For more information about these lookup tables, see Chapter 5, Image Processing, in the IMAQ Vision Concepts Manual. • imaqLookup()—Converts the pixel values of an image by replacing them with values from a user-defined lookup table. • imaqEqualize()—Distributes the grayscale values evenly within a given grayscale range. Use IMAQ Equalize to increase the contrast in images containing few grayscale values.
Chapter 2 Getting Measurement-Ready Images Nth Order Filter The imaqNthOrderFilter() function allows you to define a lowpass or highpass filter depending on the value of N that you choose. One specific Nth order filter, the median filter, removes speckle noise, which appears as small black and white dots. Use imaqMedianFilter() to apply a median filter. For more information about Nth order filters, see Chapter 5, Image Processing, of the IMAQ Vision Concepts Manual.
Chapter 2 Getting Measurement-Ready Images An image can have extraneous noise, such as periodic stripes, introduced during the digitization process. In the frequency domain, the periodic pattern is reduced to a limited set of high spatial frequencies. Also, the imaging setup may produce non-uniform lighting of the field of view, which produces an image with a light drift superimposed on the information you want to analyze.
Chapter 2 3. Getting Measurement-Ready Images To transform your image back to the spatial domain, use imaqInverseFFT(). Complex Image Operations The imaqExtractComplexPlane() and imaqReplaceComplexPlane() functions allow you to access, process, and update independently the real and imaginary planes of a complex image. You can also convert planes of a complex image to an array and back with imaqComplexPlaneToArray() and imaqArrayToComplexPlane().
3 Grayscale and Color Measurements This chapter describes how to take measurements from grayscale and color images. You can make inspection decisions based on image statistics, such as the mean intensity level in a region. Based on the image statistics, you can perform many machine vision inspection tasks on grayscale or color images, such as detecting the presence or absence of components, detecting flaws in parts, and comparing a color component with a reference.
Chapter 3 Grayscale and Color Measurements Table 3-1. Tools Palette Functions Icon Tool Name Selection Tool Function Select an ROI in the image and adjust the position of its control points and contours. Action: Click on the desired ROI or control points. Point Select a pixel in the image. Action: Click on the desired position. Line Draw a line in the image. Action: Click on the initial position and click again on the final position. Rectangle Draw a rectangle or square in the image.
Chapter 3 Grayscale and Color Measurements Table 3-1. Tools Palette Functions (Continued) Icon Tool Name Freehand Function Draw a freehand region in the image. Action: Click on the initial position, drag to the desired shape and release the mouse button to complete the shape. Zoom Zoom-in or zoom-out in an image. Action: Click on the image to zoom in. Hold down and click to zoom out. Pan Pan around an image.
Chapter 3 Grayscale and Color Measurements Figure 3-2. ROI Constructor 2. Select an ROI tool from the tools palette. 3. Draw an ROI on your image. Resize and reposition the ROI until it designates the area you want to inspect. 4. Click the OK button to output a descriptor of the region you selected. You can input the ROI descriptor into many analysis and processing functions. You can also convert the ROI descriptor into an image mask, which you can use to process selected regions in the image.
Chapter 3 Grayscale and Color Measurements Pixel Intensity Image-type indicator (8-bit, 16-bit, Float, RGB, HSL, Complex) Coordinates of the mouse on the active image window Anchoring coordinates of a Region of Interest Size of an active Region of Interest Length and horizontal angle of a line region Figure 3-3. Tools Palette Tools and Information The following list describes how you can display the tools palette in a separate window and manipulate the palette.
Chapter 3 Grayscale and Color Measurements You can also use imaqSelectPoint(), imaqSelectLine(), imaqSelectRect(), and imaqSelectAnnulus() to define regions of interest. Follow these steps to use these functions: 1. Call the function to display an image in an ROI Constructor window. Only the tools specific to that function are available for you to use. 2. Draw an ROI on your image. Resize or reposition the ROI until it covers the area you want to process. 3.
Chapter 3 Grayscale and Color Measurements When you need to make intensity measurements on particles in an image, you can use a mask to define the particles. First, threshold your image to make a new binary image. For more information on binary images, see Chapter 4, Blob Analysis. You can input the binary image or a labeled version of the binary image as a mask image to the intensity measurement function.
Chapter 3 Grayscale and Color Measurements image. Using imaqReplaceColorPlanes(), you can reassemble a color image from a set of three 8-bit images, where each image becomes one of the three primary components. Figure 3-4 illustrates how a color image breaks down into its three components.
Chapter 3 Grayscale and Color Measurements 2. Use the entire image or regions in the image to learn the color information using imaqLearnColor(), which outputs a color spectrum that contains a compact description of the color information that you learned. Use the color spectrum to represent the learned color information for all subsequent matching operations. See Chapter 14, Color Inspection, of the IMAQ Vision Concepts Manual for more information. 3.
Chapter 3 Grayscale and Color Measurements a. b. Figure 3-5. Template Color Information Specifying the Color Information to Learn You can learn the color information associated with an entire image, a region in an image, or multiple regions in an image. Using the Entire Image You can use an entire image to learn the color spectrum that represents the entire color distribution of the image.
Chapter 3 Grayscale and Color Measurements Figure 3-7. Using a Single Region to Learn Color Distribution Using Multiple Regions in the Image The interaction of light with an object’s surface creates the observed color of that object. The color of a surface depends on the directions of illumination and the direction from which the surface is observed. Two identical objects may have different appearances because of a difference in positioning or a change in the lighting conditions.
Chapter 3 Grayscale and Color Measurements 1 1 Regions used to learn color information Figure 3-8. Using Multiple Regions to Learn Color Distribution Choosing a Color Representation Sensitivity When you learn a color, you need to specify the sensitivity required to specify the color information. An image containing a few, well-separated colors in the color space requires a lower sensitivity to describe the color than an image that contains colors that are close to one another in the color space.
Chapter 3 Grayscale and Color Measurements Ignoring Learned Colors Ignore certain color components in color matching by replacing the corresponding component in the input color spectrum array to –1. For example, by replacing the last component in the color spectrum with –1, color matching ignores the color white. By replacing the second to last component in the color spectrum, color matching ignores the color black.
4 Blob Analysis This chapter describes how to perform blob (Binary Large Object) analysis on your images. Use blob analysis to find statistical information about blobs, such as the presence, size, number, and location of blob regions. With this information, you can perform many machine vision inspection tasks, such as detecting flaws on silicon wafers or detecting soldering defects on electronic boards.
Chapter 4 Blob Analysis Correct Image Distortion If you need to make accurate shape measurements based on the blobs in an image containing perspective and nonlinear distortion errors, correct the distortion using the calibration information you attached to your image. Use imaqCorrectCalibratedImage() to correct distortion in your grayscale image before thresholding it. See Chapter 6, Calibration, for more information about correcting an image using calibration information.
Chapter 4 Blob Analysis Improve the Binary Image After you threshold your image, you may want to improve the resulting binary image with binary morphology. You can use primary binary morphology or advanced binary morphology to remove unwanted blobs, separate connected blobs, or improve the shape of blobs. Primary morphology functions work on the image as a whole by processing pixels individually.
Chapter 4 Blob Analysis If you know enough about the shape features of the blobs you want to keep, use imaqParticleFilter() to filter out particles that do not interest you. If you do not have enough information about the particles you want to keep at this point in your processing, use the particle measurement functions to obtain this information before applying a particle filter. See the Make Particle Measurements section for more information about the measurement functions.
Chapter 4 Blob Analysis commonly used measurements, including the area, projection along the x-axis and y-axis, and perimeter of each blob. • imaqSelectParticles()—This function selects information about blobs from the reports generated by imaqGetParticleInfo(). Blobs that do not meet the criteria you set are filtered from the reports. • imaqCalcCoeff()—This function uses the reports from imaqGetParticleInfo() or imaqSelectParticles() to calculate 50 particle measurements.
Chapter 4 Blob Analysis Table 4-1.
Chapter 4 Blob Analysis Table 4-1.
5 Machine Vision This chapter describes how to perform many common machine vision inspection tasks. The most common inspection tasks are detecting the presence or absence of parts in an image and measuring the dimensions of parts to see if they meet specifications. Measurements are based on characteristic features of the object represented in the image. Image processing algorithms traditionally classify the type of information contained in an image as edges, surfaces and textures, or patterns.
Chapter 5 Machine Vision Figure 5-1 illustrates the basic steps involved in performing machine vision. Diagram items enclosed with dashed lines are optional steps. Locate Objects to Inspect Set Search Areas Find Measurement Points Convert Pixel Coordinates to Real-World Coordinates Make Measurements Display Results Figure 5-1.
Chapter 5 Machine Vision appears shifted and rotated in the image you need to process. This coordinate system is referred to as the measurement coordinate system. The measurement methods automatically move the ROIs to the correct position using the position of the measurement coordinate system with respect to the reference coordinate system. For information about coordinate systems, see Chapter 13, Dimensional Measurements, of the IMAQ Vision Concepts Manual.
Chapter 5 Machine Vision 1 1 2 4 2 3 4 3 1 2 a. b. Search Area for the Coordinate System Object Edges 3 4 Origin of the Coordinate System Measurement Area Figure 5-2. Coordinate Systems of a Reference Image and Inspection Image b. If you use imaqFindTransformRects(), specify two rectangles, each containing one separate, straight boundary of the object, as shown in Figure 5-3. The boundaries cannot be parallel.
Chapter 5 Machine Vision 4 2 4 2 3 3 1 1 b. a. 1 2 Primary Search Area Secondary Search Area 3 4 Origin of the Coordinate System Measurement Area Figure 5-3. Locating Coordinate System Axes with Two Search Areas 2. Use the options parameter to choose the options you need to locate the edges on the object, the coordinate system axis direction, and the results that you want to overlay onto the image. Set the options parameter to NULL to use the default options. 3.
Chapter 5 Machine Vision 1. Define a template that represents the part of the object that you want to use as a reference feature. For more information about defining a template, see the Find Measurement Points section. 2. Define a rectangular search area in which you expect to find the template. 3. Use the options parameter to select your options for finding the pattern and the results that you want to overlay onto the image.
Chapter 5 Machine Vision Choosing a Method to Build the Coordinate Transform The following flowchart guides you through choosing the best method for building a coordinate transform for your application. Start Object positioning accuracy better than ±65 degrees. No Yes The object under inspection has a straight, distinct edge (main axis). No Yes The object contains a second distinct edge not parallel to the main axis in the same search area.
Chapter 5 Machine Vision Set Search Areas Select regions of interest (ROIs) in your images to limit the areas in which you perform your processing and inspection. You can define ROIs interactively or programmatically. Interactively Defining Regions Follow these steps to interactively define an ROI: 1. Use imaqConstructROI() to display an image and the tools palette in a window. 2. Select an ROI tool from the tools palette. 3. Draw an ROI on your image.
Chapter 5 Machine Vision Programmatically Defining Regions When you have an automated application, you need to define regions of interest programmatically. You can programmatically define regions in two ways: • Specify the contours of the ROI. • Specify individual structures by providing basic parameters that describe the region you want to define. You can specify a rotated rectangle by providing the coordinates of the center, the width, the height, and the rotation angle.
Chapter 5 Machine Vision 4 3 1 2 1 2 Search Region Search Lines 3 4 Detected Edge Points Line Fit to Edge Points Figure 5-5. Finding a Straight Feature IMAQ Vision for LabWindows/CVI User Manual 5-10 ni.
Chapter 5 Machine Vision If you want to find points along a circular edge and find the circle that best fits the edge, as shown in Figure 5-6, use imaqFindCircularEdge(). 1 4 3 2 1 2 Annular Search Region Search Lines 3 4 Detected Edge Points Circle Fit To Edge Points Figure 5-6. Finding a Circular Feature These functions locate the intersection points between a set of search lines within the search region and the edge of an object.
Chapter 5 Machine Vision These functions require you to input the coordinates of the points along the search contour. Use imaqROIProfile() to obtain the coordinates along the edge of each contour in an ROI. If you have a straight line, use imaqGetPointsOnLine() to obtain the points along the line instead of using an ROI. These functions determine the edge points based on their contrast and slope. You can specify whether you want to find the edge points using subpixel accuracy.
Chapter 5 Machine Vision Finding Points Using Pattern Matching The pattern matching algorithms in IMAQ Vision measure the similarity between an idealized representation of a feature, called a template, and the feature that may be present in an image. A feature is defined as a specific pattern of pixels in an image. Pattern matching returns the location of the center of the template and the template orientation. Follow these generalized steps to find features in an image using pattern matching: 1.
Chapter 5 Machine Vision Rotationally Symmetric Rotationally Asymmetric Figure 5-7. Symmetry Feature detail A template with relatively coarse features is less sensitive to variations in size and rotation than a model with fine features. However, the model must contain enough detail to identify it. Good Feature Detail Ambiguous Feature Detail Figure 5-8. Feature Detail Positional information A template with strong edges in both the x and y directions is easier to locate.
Chapter 5 Machine Vision Background information Unique background information in a template improves search performance and accuracy. Pattern with Insufficient Background Information Pattern with Sufficient Background Information Figure 5-10. Background Information Training the Pattern Matching Algorithm After you create a good template image, the pattern matching algorithm has to learn the important features of the template. Use imaqLearnPattern() to learn the template.
Chapter 5 Machine Vision incorrect results. To avoid this, reduce the search area so that only the desired pattern lies within the search area. The time required to locate a pattern in an image depends on both the template size and the search area. By reducing the search area or increasing the template size, you can reduce the required search time. In many inspection applications, you have general information about the location of the fiducial. You should use this information to define a search area.
Chapter 5 Machine Vision However, there may be applications in which the assumptions used in the algorithm are not optimal. Knowing your particular application and the images you want to process is useful in selecting the pattern matching parameters. The following are parameters the influence the IMAQ Vision pattern matching algorithm. Match Mode You can set the match mode to control how the pattern matching algorithm treats the template at different orientations.
Chapter 5 Machine Vision Testing the Search Algorithm on Test Images To determine if your selected template or reference pattern is appropriate for your machine vision application, test the template on a few test images by using imaqMatchPattern(). These test images should reflect the images generated by your machine vision application during true operating conditions. If the pattern matching algorithm locates the reference pattern in all cases, you have selected a good template.
Chapter 5 Machine Vision Color pattern matching returns the location of the center of the template and the template orientation. Follow these general steps to find features in an image using color pattern matching: 1. Define a reference or fiducial pattern in the form of a template image. 2. Use the reference pattern to train the color pattern matching algorithm with imaqLearnColorPattern(). 3. Define an image or an area of an image as the search area.
Chapter 5 Machine Vision Feature Detail A template with relatively coarse features is less sensitive to variations in size and rotation than a model with fine features. However, the model must contain enough detail to identify it. Positional Information A template with strong edges in both the x and y directions is easier to locate. Background Information Unique background information in a template improves search performance and accuracy during the grayscale pattern matching phase.
Chapter 5 Machine Vision The training or learning process is time-intensive because the algorithm attempts to find optimal features of the template for the particular matching process. However, you can train the pattern matching algorithm offline, and save the template image using imaqWriteVisionFile(). Defining a Search Area Two equally important factors define the success of a color pattern matching algorithm—accuracy and speed. You can define a search area to reduce ambiguity in the search process.
Chapter 5 Machine Vision 1 1 Search Area for 20 Amp Fuses 2 2 Search Area for 25 Amp Fuses Figure 5-12. Selecting a Search Area for Color Pattern Matching The time required to locate a pattern in an image depends on both the template size and the search area. By reducing the search area or increasing the template size, you can reduce the required search time.
Chapter 5 Machine Vision The following are some elements in the IMAQ Vision pattern matching algorithm and how they influence pattern matching: color sensitivity, search strategy, color score weight, ignore background colors, minimum contrast, and rotation angle ranges. Color Sensitivity Use the sensitivity element to control the granularity of the color information in the template image.
Chapter 5 Machine Vision Note Use the IMAQ_CONSERVATIVE strategy if you have multiple targets located very close to each other in the image. Decide on the best strategy by experimenting with the different options. Color Score Weight When you search for a template using both color and shape information, the color and shape scores generated during the match process are combined to generate the final color pattern matching score.
Chapter 5 Machine Vision reference pattern in all cases, you have selected a good template. Otherwise, refine the current template, or select a better template until both training and testing are successful. Finding Points Using Color Location Color location algorithms provide a quick way to locate regions in an image with specific colors.
Chapter 5 Machine Vision Convert Pixel Coordinates to Real-World Coordinates The measurement points you located with edge detection and pattern matching are in pixel coordinates. If you need to make measurements using real-world units, use imaqTransformPixelToRealWorld() to convert the pixel coordinates into real-world units. Make Measurements You can make different types of measurements either directly from the image or from points that you detect in the image.
Chapter 5 Machine Vision Analytic Geometry Measurements Use the following functions to make geometrical measurements from the points you detect in the image: • imaqFitLine()—Fits a line to a set of points and computes the equation of the line. • imaqFitCircle()—Fits a circle to a set of at least three points and computes its area, perimeter and radius. • imaqFitEllipse()—Fits an ellipse to a set of at least six points and computes its area, perimeter, and the lengths of its major and minor axis.
Chapter 5 Machine Vision Use imaqFindLCDSegments() to calculate the regions of interest around each digit in an LCD or LED. To find the area of each digit, all the segments of the indicator must be activated. Use imaqReadLCD() to read multiple digits of an LCD or LED. Use imaqReadBarcode() to read values encoded in 1D barcodes. First, specify a region of interest that encloses the barcode information, and specify the type of barcode. Then, read the barcode.
Chapter 5 Machine Vision You can configure the following processing functions to overlay different types of information on the inspection image: • imaqFindEdge() • imaqFindCircularEdge() • imaqFindConcentricEdge() • imaqClampMax() • imaqClampMin() • imaqFindPattern() • imaqCountObjects() • imaqFindTransformRect() • imaqFindTransformRects() • imaqFindTransformPattern() You can overlay the following information with all the above functions except imaqFindPattern(): • The search area inp
6 Calibration This chapter describes how to calibrate your imaging system, save calibration information, and attach calibration information to an image. After you set up your imaging system, you may want to calibrate your system. If your imaging setup is such that the camera axis is perpendicular or nearly perpendicular to the object under inspection and your lens has no distortion, use simple calibration. With simple calibration, you do not need to learn a template.
Chapter 6 Calibration Defining a Calibration Template You can define a calibration template by supplying an image of a grid or providing a list of pixel coordinates and their corresponding real-world coordinates. This section discusses the grid method in detail. A calibration template is a user-defined grid of circular dots. As shown in Figure 6-1, the grid has constant spacings in the x and y directions.
Chapter 6 Calibration The origin, expressed in pixels, defines the center of your coordinate system. The angle specifies the orientation of your coordinate system with respect to the angle of the topmost row of dots in the grid image. The calibration procedure automatically determines the direction of the horizontal axis in the real world. The vertical axis direction can either be indirect, as shown in Figure 6-2a, or direct, as shown in Figure 6-2b. X Y Y a. X b. Figure 6-2.
Chapter 6 Calibration x 1 2 x y y b. a. 1 Origin of a Calibration Grid in the Real World 2 Origin of the Same Calibration Grid in an Image Figure 6-3. A Calibration Grid and an Image of the Grid If you specify a list of points instead of a grid for the calibration process, the software defines a default coordinate system, as follows: Note 1. The origin is placed at the point in the list with the lowest x-coordinate value and then the lowest y-coordinate value. 2. The angle is set to 0°.
Chapter 6 Calibration x 1 x' x 2 y' y y 1 Default Origin in a Calibration Grid Image 2 User-Defined Origin Figure 6-4. Defining a Coordinate System Learning Calibration Information After you define a calibration grid and reference axis, acquire an image of the grid using the current imaging setup. For information about acquiring images, see the Acquire or Read an Image section of Chapter 2, Getting Measurement-Ready Images. The grid does not need to occupy the entire image.
Chapter 6 Calibration Specifying Scaling Factors Scaling factors are the real-world distances between the dots in the calibration grid in the x and y directions and the units in which the distances are measured. Use the GridDescriptor structure to specify the scaling factors. Choosing a Region of Interest Define a learning region of interest (ROI) during the learning process to define a region of the calibration grid you want to learn.
Chapter 6 Calibration IMAQ_PERSPECTIVE to choose the perspective calibration algorithm. Learning and applying perspective projection is less computationally intensive than the nonlinear method. However, perspective projection cannot handle nonlinear distortions. If your imaging setup exhibits nonlinear distortion, use the nonlinear method. The nonlinear method guarantees accurate results only in the area that the calibration grid covers, as shown in Figure 6-6.
Chapter 6 Calibration Also, adjust the range parameter to distinguish the dots from the background. 3. Note Select another learning algorithm. When nonlinear lens distortion is present, using perspective projection sometimes results in a low learning score. A high score does not reflect the accuracy of your system. Learning the Error Map An error map helps you gauge the quality of your complete system.
Chapter 6 Calibration Simple Calibration When the axis of your camera is perpendicular to the image plane and lens distortion is negligible, use simple calibration. In simple calibration, a pixel coordinate is transformed to a real-world coordinate through scaling in the horizontal and vertical directions. Use simple calibration to map pixel coordinates to real-world coordinates directly without a calibration grid.
Chapter 6 Calibration Save Calibration Information After you learn the calibration information, you can save it so that you do not have to relearn the information for subsequent processing. Use imaqWriteVisionFile() to save the image of the grid and its associated calibration information to a file. To read the file containing the calibration information use imaqReadVisionFile().
Technical Support Resources A Web Support National Instruments Web support is your first stop for help in solving installation, configuration, and application problems and questions. Online problem-solving and diagnostic resources include frequently asked questions, knowledge bases, product-specific troubleshooting wizards, manuals, drivers, software updates, and more. Web support is available through the Technical Support section of ni.com NI Developer Zone The NI Developer Zone at ni.
Appendix A Technical Support Resources Worldwide Support National Instruments has offices located around the world to help address your support needs. You can access our branch office Web sites from the Worldwide Offices section of ni.com. Branch office Web sites provide up-to-date contact information, support phone numbers, e-mail addresses, and current events.
Glossary Numbers/Symbols 1D One-dimensional. 2D Two-dimensional. 3D Three-dimensional. A AIPD National Instruments proprietary image file format used for saving complex images and calibration information pertaining to step and spatial units (extension APD). alignment The process by which a machine vision application determines the location, orientation, and scale of a part being inspected. alpha channel Channel used to code extra information, such as gamma correction, about a color image.
Glossary B b Bit. One binary digit, either 0 or 1. B Byte. Eight related bits of data, an eight-bit binary number. Also denotes the amount of memory required to store one byte of data. barycenter The grayscale value representing the centroid of the range of an image's grayscale values in the image histogram. binary image An image in which the objects usually have a pixel intensity of 1 (or 255) and the background has a pixel intensity of 0.
Glossary brightness (1) A constant added to the red, green, and blue components of a color pixel during the color decoding process. (2) The perception by which white objects are distinguished from gray and light objects from dark objects. buffer Temporary storage for acquired data. C caliper (1) A function in IMAQ Vision Builder that calculates distances, angles, circular fits, and the center of mass based on positions given by edge detection, particle analysis, centroid, and search functions.
Glossary CLUT Color lookup table. Table for converting the value of a pixel in an image into a red, green, and blue (RGB) intensity. color images Images containing color information, usually encoded in the RGB form. color location The technique that locates a color template in a color image based on only the color information. color matching The technique that compares the color information in an image or region of an image to the color information in another image or region of an image.
Glossary cross correlation A technique that compares the similarity of two images or parts of an image. You can use cross correlation to find the optimal position where similarity exists. D Danielsson function Similar to the distance functions, but with more accurate results. dB Decibel. The unit for expressing a logarithmic measure of the ratio of two signal levels: dB = 20log10 V1/V2, for signals in volts. default setting A default parameter value recorded in the driver.
Glossary E edge Defined by a sharp change (transition) in the pixel intensities in an image or along an array of pixels. edge contrast The difference between the average pixel intensity before and the average pixel intensity after the edge. edge detection Any of several techniques to identify the edges of objects in an image. edge hysteresis The difference in threshold level between a rising and a falling edge.
Glossary form Window or area on the screen on which you place controls and indicators to create the user interface for your program. Fourier spectrum The magnitude information of the Fourier transform of an image. Fourier transform Transforms an image from the spatial domain to the frequency domain. frequency filters Counterparts of spatial filters in the frequency domain. For images, frequency information is in the form of spatial frequency.
Glossary H highpass attenuation Applies a linear attenuation to the frequencies in an image, with no attenuation at the highest frequency and full attenuation at the lowest frequency. highpass FFT filter Removes or attenuates low frequencies present in the FFT domain of an image. highpass filter Emphasizes the intensity variations in an image, detects edges (or object boundaries), and enhances fine details in an image.
Glossary hue offset angle The value added to all hue values so that the discontinuity occurs outside the values of interest during analysis. I image A two-dimensional light intensity function f (x, y) where x and y denote spatial coordinates and the value f at any point (x, y) is proportional to the brightness at that point. image border A user-defined region of pixels surrounding an image. Functions that process pixels based on the value of the pixel neighbors require image borders.
Glossary image visualization The presentation (display) of an image (image data) to the user. imaging Any process of acquiring and displaying images and analyzing image data. IMAQ Image Acquisition. inner gradient Finds the inner boundary of objects. inspection The process by which parts are tested for simple defects such as missing parts or cracks on part surfaces.
Glossary J JPEG Joint Photographic Experts Group. Image file format for storing 8-bit and color images with lossy compression (extension JPG). K kernel Structure that represents a pixel and its relationship to its neighbors. The relationship is specified by weighted coefficients of each neighbor. L labeling The process by which each object in a binary image is assigned a unique value. This process is useful for identifying the number of objects in the image and giving each object a unique identity.
Glossary logic operators The image operations AND, NAND, OR, XOR, NOR, XNOR, difference, mask, mean, max, and min. lossless compression Compression in which the decompressed image is identical to the original image. lossy compression Compression in which the decompressed image is visually similar but not identical to the original image.
Glossary match score A number ranging from 0 to 1000 that indicates how closely an acquired image matches the template image. A match score of 1000 indicates a perfect match. A match score of 0 indicates no match. median filter A lowpass filter that assigns to each pixel the median value of its neighbors. This filter effectively removes isolated pixels without blurring the contours of objects. memory buffer See buffer.
Glossary Nth order filter Filters an image using a nonlinear filter. This filter orders (or classifies) the pixel values surrounding the pixel being processed. The pixel being processed is set to the Nth pixel value, where N is the order of the filter. number of planes (in an image) The number of arrays of pixels that compose the image.
Glossary particle A connected region or grouping of pixels in an image in which all pixels have the same intensity level. Particles are also referred to as blobs or objects. pattern matching The technique used to quickly locate a grayscale template within a grayscale image picture aspect ratio The ratio of the active pixel region to the active line region. For standard video signals like RS-170 or CCIR, the full-size picture aspect ratio normally is 4/3 (1.33).
Glossary pyramidal matching A technique used to increase the speed of a pattern matching algorithm by matching subsampled versions of the image and the reference pattern. Q quantitative analysis Obtaining various measurements of objects in an image. R real time A property of an event or system in which data is processed as it is acquired instead of being accumulated and processed at a later time.
Glossary rotation-invariant matching A pattern matching technique in which the reference pattern can be located at any orientation in the test image as well as rotated at any degree. S saturation The amount of white added to a pure color. Saturation relates to the richness of a color. A saturation of zero corresponds to a pure color with no white added. Pink is a red with low saturation.
Glossary spatial resolution The number of pixels in an image, in terms of the number of rows and columns in the image. square function See exponential function. square root function See logarithmic function. standard representation Contains the low-frequency information at the corners and high-frequency information at the center of an FFT-transformed image. structuring element A binary mask used in most morphological operations.
Glossary V value The grayscale intensity of a color pixel computed as the average of the maximum and minimum red, green, and blue values of that pixel. W watershed A technique used to segment an image into multiple regions. web inspection The process of detecting defects in a continuous sheet of materials at production speeds. Example materials include plastic film, cloth, paper and pulp products, metal, and glass.
Index A C acquiring measurement-ready images. See measurement-ready images, acquiring.
Index coordinates, converting pixel to real-world, 4-7, 5-26 Coordinatesystem structure, 6-2 correction table, for calibration, 6-8 creating applications. See application development. creating images. See images.
Index I lowpass, 2-10 lowpass frequency, 2-12 Nth order, 2-11 finding measurement points. See measurement points, finding. Freehand Line tool (table), 3-2 Freehand tool (table), 3-3 frequency domain, 2-11 function tree, 1-2 to 1-4 IMAQ Machine Vision function types (table), 1-4 IMAQ Vision function types (table), 1-3 to 1-4 ignoring learned colors, 3-13 images. See also blob analysis.
Index imaqFillHoles() function, 4-4 imaqFindCircularEdge() function, 5-11, 5-29 imaqFindConcentricEdges() function, 5-9, 5-29 imaqFindEdge() function, 5-9, 5-29 imaqFindLCDSegments() function, 5-28 imaqFindPattern() function, 5-29 imaqFindTransformPattern() function, 5-5, 5-29 imaqFindTransformRect() function, 5-3, 5-29 imaqFindTransformRects() function, 5-4, 5-29 imaqFitCircle() function, 5-27 imaqFitEllipse() function, 5-27 imaqFitLine() function, 5-27 imaqGetAngle() function, 5-27 imaqGetBisectingLine()
Index imaqQuantify() function, 3-7 imaqRake() function, 5-12 imaqReadBarcode() function, 5-28 imaqReadFile() function, 2-6 imaqReadMeter() function, 5-27 imaqReadVisionFile() function, 2-7, 6-10 imaqRejectBorder() function, 4-3 imaqReplaceColorPlanes() function, 3-8 imaqReplaceComplextPlane() function, 2-13 imaqResample() function, 6-8 imaqROIProfile() function, 2-9, 5-12 imaqROIToMask() function, 3-4 imaqScale() function, 6-8 imaqSelectAnnulus() function, 3-6, 5-11 imaqSelectLine() function, 3-6 imaqSelec
Index lowpass frequency filters attenuation, 2-12 truncation, 2-12 imaqWriteVisionFile() function, 5-15, 5-25, 6-10 imgInterfaceOpen() function, 2-6 imgSessionOpen() function, 2-6 imgSnap() function, 2-6 instrument reader measurements, 5-27 to 5-28 invalidation of calibration, 6-8 M machine vision, 5-1 to 5-29 converting pixels coordinates to real-world coordinates, 5-26 defining region of interest for search area, 5-8 to 5-9 interactively, 5-8 programmatically, 5-9 displaying results, 5-28 to 5-29 findi
Index setting matching parameters and tolerances, 5-16 to 5-17 testing search algorithm on test images, 5-18 training the algorithm, 5-15 verifying results with ranking method, 5-18 perspective errors, calibrating. See calibration. pixel coordinates, converting to real-world coordinates, 4-7, 5-26 Point tool (table), 3-2 points, finding. See measurement points, finding.
Index S tools palette functions (table), 3-2 to 3-3 truncation highpass, 2-12 lowpass, 2-12 scaling factors, for calibration, 6-6 scaling method, for calibration, 6-8 search contour, finding points along edge, 5-11 to 5-12 Selection tool (table), 3-2 source and destination images, 2-4 to 2-5 statistics. See color statistics; grayscale statistics.