
Instruction Manual


Roboocyte2 Manual
110
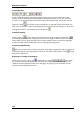
The dose-response curve calculated from the fit-parameters above which will be saved under
the file name name_CalculatedFit.dat
C (mM)_B12-0-Min_Logistic4P I min (nA)_B12-0-Min_Logistic4P
0,003 -46,4773043957504
0,00336960372515171 -100,532524488292
0,00378474308818542 -163,920109674776
0,00425102813623059 -238,117982912041
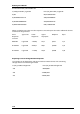
When you display more than one dose-response curve and export the results additional columns
and lines will be generated.
Dose-
Response-
Curve-ID
Type-of-Fit Lower-
Asymptote
Upper-
Asymptote
Midpoint Slope
B8-0-Min
Logistic4P -13634,3 147,7 0,033 -1,57
B10-0-Min
Logistic4P -11664,7 240,1 0,0389 -1,55
B12-0-Min
Logistic4P -11754,9 255,4 0,0369 -1,46
Exporting Current-Voltage Relationship Data
If you display an IV-dependency and export the data in ASCII format a file containing
voltage and current values be generated.
U (mV)_FirstRecordingID-143 I min (nA)_FirstRecordingID-143
-130 -48344,8601
-120 -37808,6629
-110 -28709,4663