LTP-Director Manual
Information in this document is subject to change without notice. No part of this document may be reproduced or transmitted without the express written permission of Multi Channel Systems MCS GmbH. While every precaution has been taken in the preparation of this document, the publisher and the author assume no responsibility for errors or omissions, or for damages resulting from the use of information contained in this document or from the use of programs and source code that may accompany it.
Table of Contents 1 1.1 Introduction About this Manual 1 1 2 2.1 2.2 2.3 2.4 2.5 Warnings Operator's Obligations Important Safety Advice Guarantee and Liability Terms of Use for the program Limitation of Liability 3 3 3 4 4 4 3 3.1 3.2 3.3 Configuration 5 Hardware Configuration 5 MEA2100-System 6 MEA1060-BC Amplifier 8 3.3.1 Stimulus Generator STG 9 3.3.2 Data Acquisition: MC_Card 10 3.3.3 Data Acquisition: USB-ME64- / 128- / 256-System 11 USB-MEA32-STIM4-System 16 Installing the Software 18 3.5.
LTP-Director Manual 5.2 Running an Experiment in Measurement Mode 5.2.1 Data Display Measurement Mode 5.2.2 Control Window Measurement Mode 5.2.3 Test Mode 5.2.4 Lab Book 5.2.5 Preparation 5.2.6 Experimental Protocol in Measurement Mode 5.2.7 Report Sheet 5.2.8 Recording Check List 39 39 41 42 42 45 48 54 55 6 6.1 LTP-Analyzer Replaying an Experiment in Raw Data Mode 6.1.1 Data Display Raw Data Mode 6.1.2 Control Window Raw Data Mode Analyzing an Experiment in Analysis Mode 6.2.
1 Introduction 1.1 About this Manual This manual comprises all important information about the first installation of the software LTP-Director, and about the daily work with the program. It is assumed that you have already a basic understanding of technical and software terms. No special skills are required to read this manual.
2 Warnings 2.1 Operator's Obligations The operator is obliged to allow only persons to work on the device, who are familiar with the safety at work and accident prevention regulations and have been instructed how to use the device; are professionally qualified or have specialist knowledge and training and have received instruction in the use of the device; have read and understood the chapter on safety and the warning instructions in this manual and confirmed this with their signature.
LTP-Director Manual Do not try to insert anything sharp or metallic into the vents or the case. Liquids may cause short circuits or other damage. Keep the device and the power cords always dry. Do not handle it with wet hands. Requirements for the installation 2.3 Make sure that the device is not exposed to direct sunlight. Do not place anything on top of the device, and do not place it on top of another heat producing device.
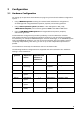
3 Configuration 3.1 Hardware Configuration For setting up an experiment with LTP-Director program you have three hardware configuration options: Using a MEA2100-System consisting of interface board and different configurations of headstages with integrated data acquisition, amplifier, and stimulus generator. Using a data acquisition system (USB-ME64- / 128- / 256-System or MC_Card), a MEA1060-BC amplifier, and a stimulus generator STG of the 2000 or 4000 series.
LTP-Director Manual 3.2 MEA2100-System The MEA2100-System consists of two main devices: The interface board with integrated high-capacity digital signal processor DSP and the headstage equipped with amplifier, A / D converter and stimulus generator. It is possible to connect one headstage only or two headstages to one interface board. The MEA2100-32-System is a descendant of the MEA2100-System with all functions except of the real-time feedback via DSP.
Welcome to the LTP-Director Click “Hardware” tab in main menu "Settings" in the first instance of LTP-Director and select the MEA2100. You can adjust the input voltage range and the sampling frequency for both connected headstages and each of the 60-electrodes MEA. In MEA2100-Systems the “Amplifier Gain” is automatically set, depending on the version of the hardware. Please select the “Input Voltage Range” and the “Sampling Frequency” according to the requirements of your experiment.
LTP-Director Manual 3.3 MEA1060-BC Amplifier For LTP experiments it is recommended to use a MEA1060-BC amplifier with blanking circuit BC. A blanking signal (TTL pulse) transiently switches off the input stage of the amplifier during the stimulus, thus avoiding the stimulus artifacts on non-stimulating electrodes. Amplifier saturation is effectively prevented and the recovery time is greatly reduced. It is also possible to record from stimulating electrode shortly after stimulation.
Welcome to the LTP-Director 3.3.1 Stimulus Generator STG Two series of stimulus generators are available from Multi Channel Systems: STG stimulus generators of the 2000 and 4000 series. They are general purpose stimulators designed to serve a very wide variety of applications. A stimulus generator is one of the requirements for using the software, because the LTP-Director displays triggered sweeps of 100 ms length.
LTP-Director Manual 3.3.2 Data Acquisition: MC_Card The MC_Card is the data acquisition card of MEA- and ME-Systems from Multi Channel Systems MCS GmbH. Please see also the separate documentation of the systems and its components for more information about the setup and operation.
Welcome to the LTP-Director 3.3.3 Data Acquisition: USB-ME64- / 128- / 256-System The USB-ME-Systems are stand-alone solutions for acquiring data from 64, 128 or 256 channels. The hardware replaces the internal data acquisition board MC_Card. The analog input signals are acquired and digitized by the USB-ME-Systems, and the digitized signals are transmitted to the connected computer via universal serial bus (High Speed USB 2.0). Thus, it is possible to use any computer for data processing.
LTP-Director Manual Setting up an USB-ME256-System with multiple instances of LTP-Director The scheme below shows the cable connections for setting up an USB-ME256 data acquisition device with four MEA1060-BC amplifiers and one STG4008. When using a USB-ME128 and only two amplifiers, the connections are similar. With the shown hardware configuration, you can then use multiple instances of LTP-Director on the same computer to control each amplifier as a completely independent unit.
Welcome to the LTP-Director Table: Connections for data transfer and amplifier control between USB-ME256 device, MEA1060-BC amplifiers and data acquisition computer. Please note that each instance of the LTP Director must be assigned to a specific data input.
LTP-Director Manual Table: Connections for TTL signals between USB-ME256 device, MEA1060-BC amplifiers and stimulus generator STG.
Welcome to the LTP-Director 6. Connect the Stimulus A and B plugs (2 mm) of the MEA1060-BC amplifiers to the Stimulus OUT plugs (2 mm) on the front panel of the STG. Additionally you have to connect the Ground GND plugs (2 mm) of the MEA1060-BC amplifiers to the STG (not listed). Please connect the Stimulus A plug of MEA A amplifier to Stimulus OUT 1 of the STG, and Stimulus B of MEA A to Stimulus OUT 2 of the STG.
LTP-Director Manual Important: After setting up the complete system with multiple instances of LTP-Director, please check the gain settings of each single instance! May be the gain setting (1100) is correct for the first instance, but incorrect for the following instances, when starting the system for the first time. 3.
Welcome to the LTP-Director Software Settings Start up to four instances of LTP-Director, and configure the settings independent of each other. Click Hardware tab in main menu "Settings". You can select all hardware settings in the hardware dialog for each instance separately. The serial number defines which device is controlled by which LTP-Director instance. The LTP-Director software assigns the settings of the different instances to the connected device.
LTP-Director Manual 3.5 Installing the Software The data acquisition computer with the MC_Card comes preinstalled and preconfigured by Multi Channel Systems MCS GmbH for a flawless operation. You should contact your local retailer for assistance if you want to install additional hard- or software, or if you want to replace the computer, as incompatibilities of hardware components or software settings with the MC_Card or LTP-Director may occur.
Welcome to the LTP-Director 3.5.2 Recommended operating system settings The following automatic services of the Windows operating system interfere with the data storage on the hard disk and can lead to severe performance limits. These routines were designed for use on office computers, but are not very useful for a data acquisition computer. Turn off Screensaver. Turn off Windows Indexing Service for all local disks. Turn off Windows System Restore.
LTP-Director Manual You do not need a license for the LTP-Director software if you like to test the software for getting an idea of how it works and what is possible. But soon as you start the LTP-Director data acquisition, the following dialog will appear. Please type the key into the window "Enter License Key" and confirm the key with "Set". The LTP-Director software license is bound to one dedicated hardware device. The license key will be saved on the device.
Welcome to the LTP-Director 4 Welcome to the LTP-Director 4.1 Welcome to LTP-Director and LTP-Analyzer Software The LTP-Director is an easy to use software package to do standardized LTP and LTD recordings in hippocampal acute slices. The LTP-Director can control MEA amplifiers and stimulus generators from Multi Channel Systems MCS GmbH from within one software. Currently, the LTP-Director can control only voltage stimulation pulses.
LTP-Director Manual 4.2 About LTP-Director Program The first part of the software package is the LTP-Director Program for online data recording. The software will always display and record triggered sweeps of 100 ms length. For setting up and running an experiment, the LTP-Director has two modes with two main windows: Test Mode and Measurement Mode. If there is no data acquisition hardware connected, the software starts in Demo Mode for simulation purposes.
Welcome to the LTP-Director 4.4 About the LTP-Analyzer Program The second part of the software package is the LTP-Analyzer for offline analysis of data, generated in measurement mode of LTP-Director. Parallel to the software concept of LTP-Director, the LTP-Analyzer software also works in two modes and with similar designed dialogs and data displays.
LTP-Director Manual 4.4.2 Analysis Mode All recorded parameters are available for analysis in the Analysis Mode of the LTP-Analyzer. You are able to rerun the analysis with new detection parameters or with different analysis electrodes as often as necessary. The data display shows red and black data traces in overlay plots depending on the stimulation pathway they are generated with. In the parameter plots data belonging to different stimulation pathways and different experimental phases is color coded.
5 LTP-Director 5.1 Preparing an Experiment in Test Mode 5.1.1 Data Display Test Mode On the left window pane of the main window there is the blue control window for setting up the experimental conditions. On the right window pane you see the data display for the electrode field. The data display will change when you select a different MEA layout. In test mode you can define the stimulation electrodes for one or two independent pathways and select up to four electrodes for online analysis.
LTP-Director Manual In measurement mode all options are enabled. Templates are used to save and load the software settings to or from a file. It can be useful to save your experimental settings, including the contents of the lab book (Please see chapter "Lab book") which can be reloaded for later experiments without having to enter all the relevant data again manually. The current settings can be saved via "Save Template” in file menu or via ”Save” button on the toolbar.
LTP-Director In the "Hardware Configuration" drop down menu you can switch between Simulation and all data acquisition systems connected to your computer. The window beneath shows the serial number of the selected device. In this dialog you also specify the "Input Voltage Range", the "Sampling Frequency", and factor of the "Amplifier Gain". Click "Perfusion" tab under "Hardware" in "Settings".
LTP-Director Manual To define a file name and a file path, click "Options" under "Settings". If you do not want to keep the default settings, browse through you folders and define the "Data Path". You can choose any file name, or optional generate the file name automatically based on the information in the Lab Book (please see chapter "Lab Book").
LTP-Director 5.1.3 View Click "View" in the main menu toolbar. Click "Load Image". It is possible to load a photo as background picture into the electrode field of the "Test Mode Control Window". You have the direct optical control of the position of your stimulation and recording electrodes. Click "Load Image" and open an image file in a new window.
LTP-Director Manual The option "Experiment Comment" opens a dialog to type in comments concerning the experiment in test mode and in measurement mode. The comments will be stored in the comment file with the extension "*.txt". You can keep the dialog open while displaying other dialogs and you can switch between test mode and measurement mode. It is possible to close the dialog, and open it again later to complete your comments. With the command "Clear" all comments are deleted. 5.1.
LTP-Director 5.1.5 Drop Down Menus The drop down menus in the main menu toolbar belong to the data display. They are one of the possibilities to change the adjustments of the x- and y-axis. For zooming and scrolling the axes via mouse, please refer to chapter "General LTP-Director Software Features". Icon "Axes Default": Resets all axes of all channels to the default. This is 10 to 40 ms for the x-axis and -2000 to +2000 V for the y-axis. With the drop down menus you can adjust the axes separately.
LTP-Director Manual Setting up the Hardware Recording and stimulation hardware connected to your computer will be detected automatically. If you have more than one stimulator, you can select one of them with the drop down menus. Here you also find the menus to specify the layout of the MEA chip and control the blanking. From the drop down menu "Layout", please choose the correct layout for your MEA chip inside the MEA amplifier. The data display will change accordingly.
LTP-Director Test Pulse Parameter Next step in setting up an experiment is to define the pulse parameters for your stimulation test pulse. You can determine the shape of the pulse, the stimulus paradigm and the pulse interval. The stimulation test pulse is for testing the response of the slices and for selecting the stimulation electrodes at each slice.
LTP-Director Manual Pulse Interval The pulse interval lasts between 0.5 and 180 seconds. This interval refers to one stimulation pathway. If you are using two stimulation pathways, pathway S2 will be delivered time delayed after pathway S1. The time delay between a stimulus on pathway S1 and S2 will be half of the selected pulse interval. Example: Selected a pulse interval of 1 min and two pathways. There will be one stimulus every 30 s alternately on pathway one and two.
LTP-Director If you select the same electrodes for stimulating and recording, and you do not use the "Blanking Feature" you will get a warning message when starting "Measurement" in test mode. Selecting Electrodes for Online Analysis To select electrodes for online analysis during the experiment, please click the "Select" button. Now it is possible to select up to four electrodes that will be analyzed online.
LTP-Director Manual Test Stimulation After pressing the start button besides "Data Acquisition", the preliminary experiment is running. Stimuli with the user defined parameters will be delivered continuously on one or both stimulation pathways. The sweeps are counted until you stop the recording manually by pressing the stop button. In "Test Mode" data is displayed but not recorded.
LTP-Director The four peristaltic pumps P1 to P4 from the left side of the device control the inlet tubes, independent from each other. They are connected to the compound bottles. The fifth peristaltic pump on the right side of the device controls the outlet tube, connected to the waste bottle. This pump works additionally as soon as one of the inlet pumps is activated and is connected to a bubble detector. The outlet pump runs as fast as all other active pumps together multiplied by 1.
LTP-Director Manual Measurement Mode Click icon “Drug Application”. The “Drug Recording” dialog appears. In this dialog you can label the three compounds of your choice in pump P1 to P3 and their concentration for the report sheet. This information has no influence on the pump speed. For the drug application phase, you can define the pump speed for all four pumps in the same way as described before.
LTP-Director 5.2 Running an Experiment in Measurement Mode 5.2.1 Data Display Measurement Mode In contrast to the "Test Mode", the function of the "Measurement Mode" is the design of the actual experiment and the recording of data. Data and analysis parameters are displayed. An experiment can consist of different phases, represented as icons. By activating or deactivating individual phases, it is possible to design the desired experimental layout.
LTP-Director Manual Main Menu Toolbar of Measurement Mode The main menu toolbar of measurement mode includes the same functions as in Test Mode. Please read chapter "Data Display Test Mode". Data Display Measurement Mode The data of the electrodes, selected in test mode is displayed on the left, and the analyzed parameter on the right. Data traces belonging to stimulation pathway S1 are shown in red, data traces belonging to stimulation pathway S2 are shown in black.
LTP-Director 5.2.2 Control Window Measurement Mode Control Window Measurement Mode: Click "Measurement" in Test Mode. The control window in measurement mode includes the online documentation (Lab Book), the control for the stimulation and detection parameters, and the experimental layout. Different modules, like baseline recording, LTP / LTD induction, drug application, and wash out can be selected or deselected to define the course of the experiment.
LTP-Director Manual Table for overview: The table below the modules for experimental proceedings gives an overview about the stimulation electrodes, the experimental timing of each phase, and about the experimental time in total. When starting more than one instance of LTP-Director the number of the currently used instance is additionally displayed. 5.2.3 Test Mode It is not possible to change stimulation electrodes or analysis electrodes in measurement mode.
LTP-Director Click the icon "Lab Book" for entering the following dialog. In "General" tab of lab book you can enter general information about the experiment and the people involved. There is also a free text field available for additional comments. The data is automatically updated based on your system clock. The date, the experiment ID and the initials of the director, scientist and technician may appear as a part of an automatically generated file name.
LTP-Director Manual In "Slice" tab of the lab book you store information about the preparation procedure. In "MEA" tab of the lab book you store information about the MEA, and you can type in comments about the pretreatment of the MEA, for example. In "Perfusion" tab of the lab book you store information about the perfusion pump and perfusion velocity. The information given in these tabs of the lab book are summarized among others - in the "Report Sheet" of the LTP-Director.
LTP-Director 5.2.5 Preparation The settings possible in preparation dialog allow changes in stimulation and detection parameters. It is also possible to run automatic IO (Input / Output) curves, and to deliver test pulses without recording data. Click the icon "Preparation" to enter the "Test Pulse" tab. With the help of this "Test Pulse" dialog - similar to the control window of test mode it is possible to adjust the stimulation parameters for the recording.
LTP-Director Manual Click the "Detection" tab. The "Detection" tab displays the channels of the four electrodes, selected in test mode for online analysis. Each electrode is labeled as somatic or dendritic, as you defined it in the test mode. In "Threshold" you set the detection level for local maxima or minima for each electrode as a multiple of the noise level. Local maxima or minima will be shown as dots in the data trace.
LTP-Director The IO curve is performed by applying 10 amplitude values in equal distance from the given minimum and maximum amplitude values in millivolt. For example: Minimum amplitude 50 mV, maximum amplitude 500 mV, resulting amplitudes: 50 100 150 200 250 300 350 400 450 500. Select one parameter for analysis from the drop down menu. The IO curve can be repeated up to three times, the results are averaged. Click to start the IO curve. If possible, a sigmoid fit curve is automatically calculated.
LTP-Director Manual 5.2.6 Experimental Protocol in Measurement Mode Once the stimulation parameters and the electrodes to be analyzed in measurement mode are selected, the outline of the experiment must be defined. Please remember, if you press the "Start" button, data is recorded. If you just want to test the stimulation, please use the "Preparation" menu. Different experimental phases can be selected or deselected to define the course of the experiment.
LTP-Director Baseline Click the icon "Baseline". As with all experimental phases, there is the possibility to enable or disable this phase by checking the "Enable" box. During the "Baseline" phase of the running experiment, the user defined stimulation paradigm is applied for a chosen period of time. This phase is often used as reference for the following phases with LTP / LTD Induction and / or drug application. The duration of the baseline recording is selected from the "Recording Time" drop down menu.
LTP-Director Manual LTP / LTD Induction Click the "LTP / LTD Induction" icon. This icon is available in three versions. The number on the pulse train symbol indicates, which stimulation pathway is used for the LTP / LTD Induction. 1 means stimulation pathway S1, 2 means stimulation pathway S2, and 1+2 means both stimulation pathways. The LTP / LTD Induction phase defines the high or low frequency stimulation that induces either long term potentiation LTP or long term depression LTD.
LTP-Director "LFS" (low frequency stimulation): Low frequency stimulation with 1 Hz stimuli for a selected duration. "Post LTP / LTD Time" in a range of 0 to 120 seconds the user can select a time span for recovery of the hippocampus slice after high frequency stimulation before the next phase starts. A graphical display of the actually selected induction protocol for both pathways is depicted in the dialog window.
LTP-Director Manual Drug Application Click icon "Drug Application". If your experimental outline includes the application of a drug, you can apply the compound in this phase of the experiment. If an automated application system is used, the drug application starts automatically. If the drug is applied manually, the program stops at the beginning of the drug phase and prompts the user to apply the drug.
LTP-Director Washout Click icon "Washout". This phase is for removing the drug from the slice, usually done by applying standard ringer solution. Analog to Drug Phase, if an automated application system is used, the washout phase starts automatically. Otherwise, the program stops at the beginning of the washout phase and prompts the user to apply ringer. In "Washout Recording" dialog again you have the typical "Recording" functions: You set "Recording Time" and "Sound Alarm".
LTP-Director Manual 5.2.7 Report Sheet Click the icon "Report Sheet". The LTP-Director will generate a complete protocol of the experiment, including the entries of the lab book, the chronological sequence and the experimental settings for each phase of the experiment. The report prepares all background information necessary for analyzing the data with LTP-Analyzer.
LTP-Director 5.2.8 Recording Check List 1. Close MC_Rack, MC_Stimulus and MEA_Select, if necessary. 2. Open LTP-Director. 3. Test Mode: Select Hardware (Settings / Hardware). Select electrode layout, MEA BC-Port and STG, if necessary. Select Data Path and Filename (Settings / Options). Load slice image, fit the image to the electrode grid. Adjust stimulation parameters. Select stimulation electrodes for pathways S1 and S2.
6 LTP-Analyzer 6.1 Replaying an Experiment in Raw Data Mode 6.1.1 Data Display Raw Data Mode The LTP-Analyzer is used to replay and analyze the data files generated by LTP-Director. Similar in design to the LTP-Director, LTP-Analyzer has two modes: Raw data mode is for displaying raw data, and analyzer mode is for analyzing data from selected electrodes.
LTP-Director Manual 6.1.2 Control Window Raw Data Mode Control Window Raw Data Mode: Control window for the experimental protocol in raw data mode.
LTP-Analyzer About Click on "About" in the header of the control window raw data mode to see information about the LTP-Analyzer software version. Help Clicking the option "Help" will open the online help file. Open Click "Open" to open a file browser and select one of the "*.ldf" files, generated by LTP-Director. Alternatively, you can open a drop down menu with recently opened files. The file name and file path of the opened files will be shown.
LTP-Director Manual To select an experimental phase, use the phase navigation drop down menu. Data from the LTP Induction phase is displayed in blue. Data from all other phases is shown as an overlay of both pathways in red (pathway S1) and black (pathway S2) for each sweep. Select Electrodes for Analysis Click "Select" to define electrodes with somatic or dendritic signals in the raw data display.
LTP-Analyzer View Settings Click "View Settings" to review all available setting of the actual used LTP-Director file. The information is organized in a tree view.
LTP-Director Manual 6.2 Analyzing an Experiment in Analysis Mode 6.2.1 Data Display Analysis Mode On the bottom left corner of your screen, you can toggle between "Raw Data" and "Analysis" mode. The design of the main window of the Analysis Mode of LTP-Analyzer is similar to that known from the measurement mode of LTP-Director: On the left side, there is the blue control window, besides the data display. The data display is separated into smaller windows.
LTP-Analyzer Data Trace Window On the left part of the display you see the data traces of the four - in raw data mode selected electrodes one below the other. Data traces belonging to stimulation pathway S1 are shown in red, data traces belonging to stimulation pathway S2 are black. Both data traces are displayed in overlay. Data traces of the LTP / LTD Induction phases are blue. The data traces are marked with dots (in red or black).
LTP-Director Manual Parameter Trace Window On the right part of the main window you see the parameter display for the online analysis related to the four selected electrodes. All available parameters are analyzed. The drop down menus in the toolbar can be used to select the parameter to be displayed. Different parameters can be displayed for somatic and dendritic electrodes. The colors of the data points encode the different phases of the experiment.
LTP-Analyzer Hint: To handle the multiple display features for scrolling and zooming, for example, please read chapter "General LTP-Director Software Features". Option: Relative Values To compare data from different experiments, absolute values from individual experiments are usually normalized on the baseline of the respective experiment. This can be done automatically in LTP-Analyzer before exporting the data as ASCII file.
LTP-Director Manual 6.2.2 Control Window Analysis Mode In the control window it is possible to navigate between experimental phases and sweeps, and to adjust the detection threshold for the individual electrodes. Data can be analyzed sweep by sweep, using the arrow buttons, or the whole data file can be analyzed at once with the "Analyze" button.
LTP-Analyzer Sweep Navigation Sweep navigation is identical to raw data mode. You can select the designated sweep from the drop down menu, or you can navigate by clicking the icons besides the drop down menu. The button selects the next sweep, the experimental phase. button selects the last sweep of the To select an experimental phase, use the phase navigation drop down menu. Data from the LTP Induction phase is displayed in blue.
LTP-Director Manual Report Click the icon "Report" to create a report sheet with all relevant information about the lab book and the experimental settings of the actual analyzed file.
7 General LTP-Director Software Features 7.1 Display Toolbar for Single Channel View Double-click on one channel of the data display. The window will be enhanced and you will find several options for dealing with the data. Several tools for zooming and scrolling the data as well as exporting the graph are provided on the toolbar of the enhanced online display. Enable scrolling Scroll the axes by clicking and dragging with your mouse or by pressing keys on your keyboard.
LTP-Director Manual 3. Click on the right mouse button. Click "Tracking Enabled". While holding down the left mouse button, move the mouse pointer to the left and right, or up and down. - OR – You can use the keyboard: Press LEFT ARROW or DOWN ARROW to move the selected axis to the left (down), RIGHT ARROW or UP ARROW to move the selected axis to the right (up).
General LTP-Director Software Features Showing / hiding the data cursor labels Click to show a vertical cursor or a crosshair. The cursor shows the x- and y- values for the trace line of the assigned channel. By right mouse click on the cursor, a context menu is displayed where you can change the channel assignment. ASCII Export of Graphics Click to save the displayed data as a tab-delimited ASCII file (text without formatting).
LTP-Director Manual Plot Axes Editor If you click on an axis with the right mouse button, for example, in the parameter window of the LTP-Analyzer, following menu appears. You have four options: "Tracking Enabled", "Update Resume Values", "Zoom To Fit" and "Edit". Click "Edit". With the "Plot Axis Editor" you can adapt the format of the graph, for example, for special requirements of a publication.
8 Signal Detection 8.1 Signal Detection All input signals are filtered by a Savitzky Golay filter. The Savitzky Golay method essentially performs a local polynomial regression on a series of values to determine the smoothed value for each point. The purpose is to smooth a noisy signal without greatly distorting the signal. Please set the parameters of the Savitzky Golay filter in main menu "Settings", "Filter". To analyze the data of each sweep it is necessary to detect the evoked response of the slice.
LTP-Director Manual If the three point pattern matches more than once for the signal, the other matches are marked in the signal trace as well. For the analysis of the signal parameters the pattern with the maximum amplitude is used for calculation. EPSP or PS Amplitude For calculation of the amplitude either somatic or dendritic, the distance between baseline and absolute maximum or minimum point is the background.
Signal Detection PS Area The PS Area is calculated as area between the signal maximum and the straight line connecting the left and right extremum points. The first value counted is first value of the trace below the baseline. The last value is taken either the first value above the baseline or a fixed limit. The left and right borders are the left and right extremum points. The PS Area value is in units of μV * ms (10-9 Vs). EPSP Area The EPSP Area is the area between the data trace and the baseline.
LTP-Director Manual EPSP Slope The slope is calculated by using a linear regression line of the data points in the 10 % to 90 % (or 30 % to 70 %) interval of the first EPSP amplitude (stretching from extremum to baseline) in the region of interest. The slope of the resulting straight line is extracted as the EPSP slope value. The EPSP Slope value is in units of V/s.
9 Troubleshooting 9.1 About Troubleshooting The following hints are provided to solve special problems that have been reported by users. Most problems occur seldom and only under specific circumstances. Please check the mentioned possible causes carefully when you have any trouble with the product. In most cases, it is only a minor problem that can be easily avoided or solved. If the problem persists, please contact your local retailer. The highly qualified staff will be glad to help you.
LTP-Director Manual LTP-Director: Data Display Test Mode The amplitude of the stimulus test pulse has to be an integral number in a range between 0 and 8000 mV. Please select an appropriate value. LTP-Director: Data Display Measurement Mode Parameter Window When running an IO curve under "Preparation" in measurement mode, the program will try to fit the data to a sigmoidal function. If the data is not sigmoidal, you will receive the error message "Unable to fit data" shown above.
10 Appendix 10.1 Contact Information Local retailer Please see the list of official MCS distributors on the MCS web site. User forum The Multi Channel Systems User Forum provides the opportunity for you to exchange your experience or thoughts with other users worldwide. Mailing List If you have subscribed to the mailing list, you will be automatically informed about new software releases, upcoming events, and other news on the product line.
LTP-Director Manual 80
Index 11 Index 81
LTP-Director Manual 82
Drug Application .............................. 48 LTP / LTD ............................................ 48 LTP / LTD Induction ........................... 48 Recording Check List ........................ 48 Report Sheet ..................................... 48 Washout ............................................ 48 A About Analysis Mode 25 62, 77 ASCII Export of Graphics 69 Axes Default 25 F B Baseline Value 48 Blanking function 31 C Control Window Analysis Mode 66 Analysis ...................
LTP-Director Manual PS ....................................................... 73 Region of Interest ............................. 73 Slope .................................................. 73 P Parameter Trace Window 62 Preparation 41 Software 18 Pulse 31 Pulse Interval .....................................31 Pulse Shape..................................31, 41 Stimulation 31 Stimulation Pathways ....................... 31 Stimulus Paradigm ............................
85