
Specifications


7.
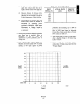
Starting at right edge of baseline, draw a
vertical line 10 blocks long. Label tbis line
“% Cam Rotation”.
8. Scale. “% Input Signal” line by marking
baseline 0%. Mark 10% point one block
upward. Continue labeling in 10%
increments up to 100%.
9. Scale baseline by marking left end 0%.
Mark 20% point two blocks to right
horizontally. Continue labeling in 20%
increments up to 100%.
10. Plot points on graph (Graph 2) with data
from system flow chat (Table A-l). For
example: Using Table A-l in Graph 2, at a
20% input signal, percent of flow is 35%;
follow 20% input signal line until it
intersects 35% flow line; place a mark at
tbis point. Repeat this procedure for 40%,
60%, SO%, and 100% input signals, placing
marks at each intersection with
corresponding flow line. Connect these
points with a smooth curve starting at a
point with zero % flow and zero % input
signal. Label curve X.
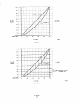
11. Draw a straight line from zero point on
curve X to 100% point on curve X. Label
this line curve Y.
12. From 10% increment on “% Input Signal”
13.
14.
15.
16.
17.
18.
19.
20.
From point in step 12, draw a vertical line
downward to meet curve X.
From point in step 13, draw a horizontal line
to “% Cam Rotation” scale.
Repeat process from step 12 through step 14
for 20% to 90% input signal.
Value of “% Cam Rotation” is read where
line in step 14 intersects “% Cam Rotation”
scale. Estimate value by using percentage
scale on left edge of graph. Copy Table A-2
and record values in % Cam Rotation in
blank column and again in Table 4-1
Characterized column for future reference.
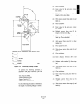
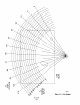
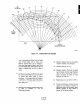
Make a copy of Figure A-6, Cam Shaping.
Plot points from Table A-2 on copy of cam
Refer to example in Figure A-7.
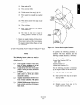
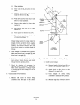
Set compass for 0.4375 inch radius and draw
0.875 inch circles using points plotted in
step 18 as cemer.
Draw a smooth curve
connecting edges of
circles that are on same side as cam’s
mounting holes. This is shape of new cam
contour. Make several copies for future
reference.
scale, draw a horizontal line to curve Y 21. Cut out paper cam leaving new cam contour,
(Graph 3). mounting hole, and slotted hole.
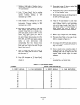
Table A-2. Cam Rotation Points.
Example: Record Values from step (p):
% INPUT SIGNAL % CAM ROTATION
0
10
20
30
40
50
60
70
80
90
100
% INPUT SIGNAL
0
10
20
30
40
50
60
70
80
90
100
% CAM ROTATION
18.102-208
A-9