
Specifications
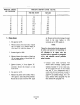
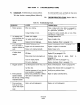


PERCENT SIGNAL
AIR PRESSURE
0 0 0.0 0.0
10
10
31.6
1.0
20 20 44.8 4.0
30 30 54.8
9.0
40
40 63.25 16.0
50 50 70.7 25.0
60 60 77.5
36.0
70 70 83.7 49.0
80 80 89.4 64.0
90 90 94.9 81.0
100
100 100.0 100.0
l-
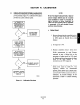
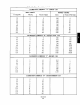
Table 4-1. Device Travel (%).
PERCENT DRIVEN LEVER TRAVEL
LINEAR
SQUARE ROOT
CJX)
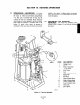
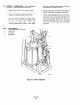
b. Piston Travel.
1. Set signal air to 0%
2. Measure distance from top surface of gland
cap (13, Figure 3-1) to bottom surface of
clevis head (14). Label this distance “A”.
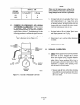
3. Increase signal to 100%.
4. Measure distance from surface of gland cap
(13) to bottom surface of cl&s head (14).
Label this distance “B”.
5. Subtract distance “A” from distance “B”.
This is total stroke travel of the power
positioner. Record this distance as total
stroke travel.
6. Set signal air to O%,
7. Measure the piston travel (stroke) when a
10% signal is sent to the power positioner.
Record this as stroke travel for 10% signal
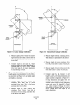
SQUARE
cx’,
CHARACTERIZED
air. Measure and record percentage of output
travel in the same fashion in 10%
increments up to 100% signal air.
NOTE
Values for characterized stroke measured
in inches and percent corresponding to
input pressures are recorded in Table
4-2, Schedule D. If values were not
recorded, refer to Appendix A, paragraph
A-2.b., and calculate correct positions
using formulas.
8. Compae actual stroke movement with
desired stroke movement. Desired stroke
movements appear in Table 4.2, Calibration
Schedule. Schedule “A” is for a linear cam,
“B” for a square root cam, “C” for a square
cam, and “D” for a characterized cam. If
actual stroke of power positioner is equal to
desired value in Table 4-2, refer to para-
graph 4-4 and calibrate linkage. If it is not
equal, calibrate stroke @amgraph 4-2) and
then calibrate I/P (paragraph 4-3).