
User guide


ManageEngine Firewall Analyzer :: User Guide
63
Zoho Corp.
The Top Hosts graph shows the top hosts generating events along with the respective
event severities. The table below the graph shows the host name or IP address, the
event severity, the number of events, and the number of bytes of traffic generated.
Drill down from this graph to see the following graphs:
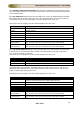
Graph
Description
Top Event
Messages
The top event messages generated and corresponding event ID
The Event Summary pie-chart shows the number of events generated, grouped by
event severity. The table below the graph shows the event severity, number of events
generated with that event severity, and the number of bytes of traffic generated.
Drill down from the pie-chart to see the following details:
Graph
Description
Top Hosts
The top hosts that generated events of this severity
Top Event
Messages
The top event messages received with this severity along with the hosts
which generated them
Event Messages will list all the event messages in the descending order of number of
events along with the severity.