
User guide


ManageEngine Firewall Analyzer :: User Guide
51
Zoho Corp.
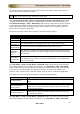
graph shows the top users grouped by summing the number of bytes sent and received
by each protocol group. The table below each graph shows the user name, the protocol
used, number of hits, and the number of bytes sent or received as applicable.
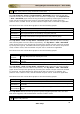
Drill down from each of the above graphs to see the following graphs:
Graph
Description
Top
Destinations
The top destinations accessed by the user
Top Hosts
The top hosts used by user in generating traffic
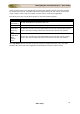
Traffic
Distribution
- Working
Hours
The amount of traffic that was generated by the user during working hours,
which is the daily average value since the time the server was started.
Traffic
Distribution
- Non-
working
Hours
The amount of traffic that was generated by the user after working hours,
which is the daily average value since the time the server was started.
The Top Rules table shows the top protocol groups triggering firewall rules, the (Rule
Number IDs) rules that were triggered, the destination and the number of hits.