
User guide


ManageEngine Firewall Analyzer :: User Guide
50
Zoho Corp.
Click on the PDF to export this report to PDF. Click on the CSV to export this report to
CSV format (comma separated values).
Click on the Protocol Groups link under the Settings tab to see what protocols fall
under each protocol group, and how to edit them.
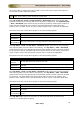
The Top Protocol Groups - Sent and Top Protocol Groups - Received graphs show
the top protocol groups sending and receiving data across the device respectively. The
Top Protocol Groups - Sent + Received graph shows the top protocol groups grouped
by summing the number of bytes sent and received by each protocol group. The table
below each graph shows the protocol group name, number of hits, and the number of
bytes sent or received as applicable.
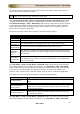
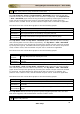
Drill down from each of the above graphs to see the following graphs:
Graph
Description
Top Protocols
The top protocols in this protocol group
Top Hosts
The top hosts generating traffic using protocols in this protocol group
Top Users
The top users generating traffic using protocols in this protocol group
Top
Destinations
The top destinations accessed by protocols in this protocol group
Top
Conversations
The top conversations using protocols in this protocol group
Traffic
Distribution -
Working
Hours
The amount of traffic that was generated by each protocol group during
working hours, which is the daily average value since the time the server
was started.
Traffic
Distribution -
Non-working
Hours
The amount of traffic that was generated by each protocol group during
non-working hours, which is the daily average value since the time the
server was started.
The Top Hosts - Sent and Top Hosts - Received graphs show the top hosts sending
and receiving data across the device respectively. The Top Hosts - Sent + Received
graph shows the top hosts grouped by summing the number of bytes sent and received
by each host. The table below each graph shows the host name or IP address, the
protocol used, number of hits, and the number of bytes sent or received as applicable.
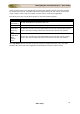
Drill down from each of the above graphs to see the following graphs:
Graph
Description
Top Destinations
The top destination hosts or IP addresses accessed by these
hosts
Top Users
The top users using this host in generating traffic
Traffic Distribution -
Working Hours
The amount of traffic that was generated by the host during
working hours, which is the daily average value since the time
the server was started.
Traffic Distribution -
Non-working Hours
The amount of traffic that was generated by the host after
working hours, which is the daily average value since the time
the server was started.
The Top Users - Sent and Top Users - Received graphs show the top users sending
and receiving data across the device respectively. The Top Users - Sent + Received