
User guide


ManageEngine Firewall Analyzer :: User Guide
42
Zoho Corp.
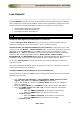
By default User Input radio button is selected. If you want to manually enter the
interface details, carryout in this screen as given below: In the User Input screen,
Device Name, Interface Name will be displayed. Besides the name of the interface,
you will find
edit icon. Click the icon to change the interface name as per your
requirement. The result will take effect immediately. You can enter the Interface IP,
Interface IP, Up Link Speed (in Kbps), and Down Link Speed (in Kbps) values
manually.
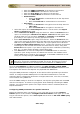
Select the Get from SNMP query radio button if you want the application to
automatically query the interface through SNMP and fetch the interface details. In the
Get from SNMP query screen, Device Name will be displayed and you can enter the
Device IP Address, SNMP Community and SNMP Port. Enter the the SNMP
Community and SNMP Port parameters. Using the SNMP parameters configured, the
specific interface will be queried to get interface details.
Click Save button to save the configuration and Cancel button to cancel the operation.
SNMP base Live report graphs are populated based on SNMP OID's ifInOctets and
ifOutOctets. As these OID's are incremental counters we do not plot graph at a point
when any of these counters gets reset.
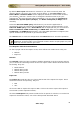
Live Reports of Each Firewall Device
On the top right side of the Report screen, there will be two combo boxes. They are:
• Refresh
• Export as
Refresh
The Refresh combo box lets to enable or disable refreshing of the Live reports and lets
you to choose the refreshing interval of the Live reports. There will be three field values
for filtering. They are:
• Never Refresh
• Refresh Every 1 Min
• Refresh Every 5 Min
• Refresh Every 10 Min
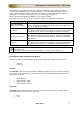
Export as
The Export as combo box lets you choose the format of the reports for export. There
will be two formats for exporting. They are:
• PDF
• CSV
Click on the PDF to export this report to PDF. Click on the CSV to export this report to
CSV format (comma separated values).
Click the Live Reports link present inside the list of reports for a device, to see the live
reports for that device alone, over all the time periods described above.