
User guide


ManageEngine Firewall Analyzer :: User Guide
32
Zoho Corp.
Using the Sub Tab
The sub tab provides links to frequently accessed reports and tasks in Firewall Analyzer.
It also shows the current server status using intuitive icons.
The following reports can be generated by clicking the corresponding links in the sub
tab:
Link
Action
Interface/Zone
Reports
View live traffic reports for the past one day for each firewall, on a 5-
minute average. The Live Reports are available for each interface or
zone of the device separately.
Application
View application reports for the selected firewall. You can select the
device using the drop down list.
The following tasks can be done by clicking the corresponding links in the sub tab:
Link
Action
Add
New
Alert
Profile
Create a new alert profile to trigger alerts and send notifications
Report
Profile
Create a new custom report profile
Syslog
Server
Add a virtual syslog server to receive logs from different ports
Import Logs
Import a log file from your local machine or through FTP
Advanced Search
Offers numerous options for making your searches more precise and
getting more useful results. Reports can be scheduled from the search
results.
The purpose of each icon in the sub-tab is described below:
Icon
Description
Packet Count - the number of packets received from each device sending log files
to the server. For troubleshooting, admin users can view the cumulative flow rate
of logs received by Firewall Analyzer at the syslog listening ports from all the
configured firewalls.
or
Listening Ports - the list of ports at which the server is listening for logs and
devices that are sending logs to the syslog server at the particular port. If any of
the ports is down, then you would receive a message in web UI
"Syslog listener
port is down"
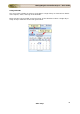
Live Syslog Viewer - View raw packets. This will give the live syslog details i.e.,
Source IP, Destination IP, Port and syslog informations, provided the interfaces
(i.e., eth0 etc.) should be open. In Linux the application should be started using
root user. You can apply filter on Source IP and Port to get live syslogs received
from particular IP/Port. If you click Live Syslog Viewer icon, the Firewall
Analyzer - Syslog Viewer screen pops up. In the screen, on top you will find