
User guide

ManageEngine Firewall Analyzer :: User Guide
27
Zoho Corp.
you to watch the live syslogs from the filtered host and port. In the case, since you
clicked from a specific device, the specific Firewall device information is loaded in to it by
default. The fields of the syslog packets displayed are: Source, Destination, Port, and
Message.
Click the View Syslog link is provided in Home > Traffic Statistics > Device Name
(besides the Proxy device). Ensure that the device has data for the selected calendar
time range. This will show the raw syslogs information for the specific proxy device.
The traffic values in the table let you drill down to see traffic details for the
corresponding protocol group in the Protocol Usage Report.
The
Quick Reports link provides you 'quick' access to the top level details of traffic
like Top Hosts, Top Destinations, Top Conversations, Top Protocol Groups, Top Firewall
Rules, Top VPN Reports, and Top Attack Reports for the corresponding firewall.
Quick Reports for Squid Proxies will provide only the following reports: Top Hosts,
Top Destinations, and Top Conversations.
The
icon next to the Unassigned protocol group indicates traffic details for protocols
that have not been assigned to any protocol group. Click the icon, and under the View
Identifiers tab, you can see the traffic details for each of these unassigned protocols.
The Assign Group tab provides you with options to either associate these unknown
protocols to the predefined Protocol Groups (and Protocols) or create a new Protocol
Group (and Protocol). You can do this by selecting from the listed identifier and assigning
it to either the pre-defined Protocol Group (and Protocol) or create a
new protocol
group (and new Protocol).
Multiple Selection enables you to assign multiple identifiers to a particular protocol
group (and protocol). Single selection enables you to assign each of the individual
identifier to a particular protocol group (and protocol).
The Security Statistics table, shows the Security Overview graph's data in more detail,
along with the distribution of the Configured Alerts.
Click the View Syslogs link is provided in Home > Security Statistics > Device
Name (besides the Firewall device). Ensure that the device has data for the selected
calendar time range. This will show the recent security events for the specific firewall. If
you click View Syslogs link, the Recent Security Events screen pops up. In that
screen you can view latest Security Events received from device for the time duration
<Last 15 Mins, Last 30 Mins, Last 1 Hour, Last 2 Hours, Last 3 Hours, Last 6
Hours>. In the screen, on top you will find Formatted Logs, Raw Logs tabs. You can
choose the tabs to view either formatted logs or raw logs. Click
Configure Columns
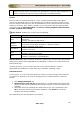
to select the columns to be displayed for the formatted logs The columns are: All
Columns, Device, Host, User, Protocol, Destination, Date/Time, Virus/Attack, VPN,
Severity, Rule Number/ID, Status, URL, Duration, Description, StartTime.
Below that, the number of lines of logs displayed are indicated in the Showing : _ to _
of total _ logs field. The number lines displayed per page is indicated in the View per
page : 5 [10] 20 25 50 75 100 250 500 field. Default value is 10. The default
columns displayed are: Host, Protocol, Destination, Date/Time, Status, Severity, and
Description. You can add or remove columns using Configure Columns icon given
above.
The Configured Alerts are classified according to the priority as High, Medium, and Low.
Clicking on the alert counts against High, Medium, Low, or All Alerts will list you