
User guide


ManageEngine Firewall Analyzer :: User Guide
269
Zoho Corp.
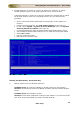
2. Firewall Analyzer displays "Port 8500 needed by Firewall Analyzer is being used
by another application. Please free the port and restart Firewall Analyzer" when
trying to start the server.
Probable cause: The default web server port used by Firewall Analyzer is not
free.
Solution: Kill the other application running on port 8500. If you cannot free this
port, then change the web server port used in Firewall Analyzer.
3. Unable to start the application in Linux
Probable cause: It is due to invalid host information in the etc/hosts directory.
Solution: Change it to the following format, you will be able to start the
application and get reports.
/etc/hosts
Entry should be like:
127.0.0.1 mini localhost
Importing Logs
1. Firewall Analyzer not importing logs from mapped network drive, if Firewall
Analyzer is running as service.
Solution: Instead of giving mapped network drive, you give UNC path
(\\ComputerName\SharedFolder\Resource) (e.g., \\cherry\log\isa_log*.w3c).
If the issue still persist, check the following:
• The account in which Firewall Analyzer service runs must have full
privilege to that shared drive
• If the Firewall Analyzer machine is in a domain xxxxx and the shared
machine/drive is in a workgroup (i.e., cross domain), Firewall Analyzer will
not fetch the logs unless the full domain admin privilege is available.
Reporting
1. Why am I seeing empty graphs?
Probable cause:Graphs are empty either because there is no traffic is passing
through the firewall or if firewall traffic is not sufficient enough to populate the
reports table of Firewall Analyzer.
Solution: If you are starting Firewall Analyzer for the first time or if you are
shutting down and restarting Firewall Analyzer, it will wait for the reports table to
be populated with 5000 log records for the first time. From the next time
onwards, Firewall Analyzer will populate reports table once in 7 minutes or once it
receives the next 5000 records, whichever is earlier. You can check for the
number of records received in " Packet Count " icon shown in top right corner in
client UI. This will list out the details like the number of logs received and also the