
User guide


ManageEngine Firewall Analyzer :: User Guide
248
Zoho Corp.
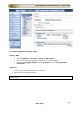
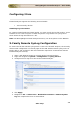
12. Click the pencil icon next to the first rule in the Firewall Rule table. This will open
the rule for edit, as in the example below.
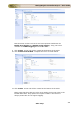
13. Click the Enable syslog logging checkbox as shown, then click Save.
14. Repeat steps 12 and 13 for all the Firewall Rules until syslog logging is enabled on
them all.
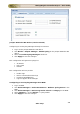
Troubleshooting Operation with ManageEngine Analyzer
The Firewall Analyzer home page shows the “Dashboard” which is an overview of all the
devices that are being monitored, showing traffic levels and security events that have
been reported. The X-family device should appear here. If it does not, see the
troubleshooting section below.
The following is a list of things to check if the ManageEngine Firewall Analyzer does not
operate correctly:
1. Check the syslog server settings on the X-family device are configured to point to
the IP address of the Firewall Analyzer Server.
2. Check that the Firewall Analyzer Server is listening on the same port (usually UDP
514) as the X-family syslog client is sending on.
3. Check that any firewall device between the X-family and the Firewall Analyzer
Server has a rule permitting traffic for UDP port 514.
4. Check that there is no syslog daemon running on the same PC as the Firewall
Analyzer Server – or it will take over port 514 which will stop the syslog data
from going to the Firewall Analyzer Server.
5. Traffic through the X-family device will only be counted if it is subject to a Firewall
Rule and syslog logging is enabled for that rule. For example traffic will not be
counted if:
- it is passing between hosts in the same security zone
- it is passing over a VPN or GRE tunnel to a host which is in the same zone as is
used to terminate the VPN or GRE tunnel.