
User guide


ManageEngine Firewall Analyzer :: User Guide
106
Zoho Corp.
below the graph shows the host name, IP address, or user name of the source, along
with the protocol used, the number of hits, and the total traffic in bytes.
The Top WAN Hosts and the Top WAN Users graphs show the respective top hosts
and top users whose requests could not be processed by the proxy cache. The table
below the graph shows the host name, IP address, or user name of the source, along
with the protocol used, the number of hits, and the total traffic in bytes.
The Top Users (LAN + WAN) shows the top values when the Top LAN Users and Top
WAN Users records are combined. The table shows the User, the host name or IP
address of the source from which he is conducting the conversation, the type of user
(LAN or WAN) , the number of hits and bandwidth usage.
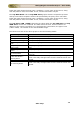
Drill down from each of the above graphs to see the following details:
Report
Description
Top Sites
The top web sites accessed by this user or host
Top Pages
The top web pages or URL's accessed by this user or host
Top Denied Web Pages
The top web pages that were denied for this user or host
Cache Usage - Cache
Code
The cache usage by this user or host, based on cache code
Proxy Usage - HTTP
Status Code
The proxy usage by this user or host, based on HTTP status
code
Proxy Usage - Peer
Status
The proxy usage by this user or host, based on peer status
Top Users/Hosts
The top users or hosts accessing the proxy through this
host/user
Traffic Distribution -
Working Hours
The amount of traffic that was generated during working hours,
which is the daily average value since the time the server was
started.
Traffic Distribution -
Non-working Hours
The amount of traffic that was generated after working hours,
which is the daily average value since the time the server was
started.