ManageEngine Firewall Analyzer :: User Guide Table of Contents INTRODUCTION ........................................................................................................ 5 About Firewall Analyzer ..................................................................................................... 6 Release Notes ................................................................................................................... 7 Supported Firewalls ................................................
ManageEngine Firewall Analyzer :: User Guide Streaming and Chat Sites Reports ................................................................................... 76 Security Reports .............................................................................................................. 78 Virus Reports ................................................................................................................... 80 Attack Reports ...................................................................
ManageEngine Firewall Analyzer :: User Guide Mapping User Name vs IP Address using DHCP/Proxy Logs ........................................ 151 Importing Log Files ........................................................................................................ 156 Viewing Device Details .................................................................................................. 160 Archiving Log Files ............................................................................................
ManageEngine Firewall Analyzer :: User Guide Configuring SonicWALL Internet Security Appliances .................................................... 240 Configuring Juniper Devices .......................................................................................... 241 Configuring 3Com .......................................................................................................... 245 X-Family Remote SysLog Configuration ......................................................................
ManageEngine Firewall Analyzer :: User Guide Introduction A Firewall is an important perimeter defense tool which protects your network from attacks. Security tools like Firewalls, VPN's, and Proxy Servers generate a huge quantity of traffic logs, which can be mined to generate a wealth of security information reports.
ManageEngine Firewall Analyzer :: User Guide About Firewall Analyzer Firewall Analyzer automatically collects, correlates, and analyzes security device information from enterprise-wide heterogeneous firewalls, and proxy servers from Cisco, Fortinet, CheckPoint, WatchGuard, NetScreen, and more.
ManageEngine Firewall Analyzer :: User Guide Release Notes The new features, enhancements, and bug fixes in the 7.2.0 release are mentioned below. • 7.2.0 - Build 7020 (GA) 7.2.0 - Build 7020 GA release of Firewall Analyzer 7.2.0 - Build 7020 - Distributed Edition GA release of Firewall Analyzer Distributed Edition. New Features - Collector Server The general features available in this release include, • Collector Server contains all the features of Firewall Analyzer Standalone Edition 7.2.
ManageEngine Firewall Analyzer :: User Guide 12. Option to fetch Rules and Configurations for any CLI supported device to get Unused Rules, Compliance and Change Management reports 13. New format for Email alert to cater for context based Configuration Changes 14. Optional privilege available to 'Guest' user to view the generated alerts for the assigned device(s) 15. Optional privilege available to 'Guest' user to view the Report Profile(s) assigned by Administrators Bug Fixes 1.
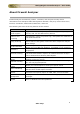
ManageEngine Firewall Analyzer :: User Guide Supported Firewalls Firewall Analyzer is compatible with the following firewall devices.
ManageEngine Firewall Analyzer :: User Guide Company Name Device/Version (versions up to) WELF Certified Other Log Format Consultants Fortinet FreeBSD Funkwerk UTM Global Technologies IPCop Ingate Inktomi Juniper Kerio Lenovo Security Technologies Lucent McAfee (formerly Secure Computing) Microsoft NetApp NetASQ NetFilter Netopia Network-1 Palo Alto Recourse Technologies Ruijie Securepoint Snort SonicWALL Squid Project St.
ManageEngine Firewall Analyzer :: User Guide Company Name Sun Microsystems WatchGuard Zywall Device/Version (versions up to) WELF Certified Other Log Format SunScreen Firewall v3.1 All Firebox Models v 5.x, 6,x, 7.x, 8.x, 10.x, 11, Firebox X series, x550e, x10e, x1000, x750e Most versions Zoho Corp.
ManageEngine Firewall Analyzer :: User Guide Installation and Setup System Requirements This section lists the minimum system requirements for installing and working with Firewall Analyzer. Please refer our website for recommended system requirements.
ManageEngine Firewall Analyzer :: User Guide Hard Disk Space Requirement The split up is: Archive+Index+MySQL=Total Log Records Rate For 1 Day For 1 Week For 1 Month 50 Logs/sec 1+0.5+10.5=12 GB 5+3+30=38 GB 18+7+75=100 GB 100 Logs/sec 2+1+15=18 GB 10+5+50=65 GB 35+15+100=150 GB 300 Logs/sec 6+3+31=40 GB 30+15+105=150 GB 100+45+295=440 GB 500 Logs/sec 10+5+75=90 GB 50+25+225=300 GB 170+70+480=720 GB 1000 Logs/sec 20+10+150=180 GB 95+45+500=640 GB 325+125+950=1.
ManageEngine Firewall Analyzer :: User Guide Note: The Log Records Per Second is the total log records received per second by Firewall Analyzer from all the configured devices. MySql Performance Improvement Parameters For better performance, we recommend replacing the existing MySQL parameters mentioned in startDB.bat/sh, available under \bin directory, with the following MySQL parameters changes for the corresponding RAM Size.
ManageEngine Firewall Analyzer :: User Guide • • • Netscape 7.0 or later Mozilla 1.5 or later Firefox 1.0 or later Zoho Corp.
ManageEngine Firewall Analyzer :: User Guide Prerequisites This topic deals with the following pre-requisites for setting up Firewall Analyzer in your enterprise. • • • Ports to be Freed Recommended System Setup Changing Default Ports Ports to be Freed Firewall Analyzer requires the following ports to be free: Port Number 8500 514, 1514 33336 Usage This is the default web server port. You will access the Firewall Analyzer server from a web browser using this port number.
ManageEngine Firewall Analyzer :: User Guide Changing the default web server port: 1. Edit the sample-bindings.xml file present in the /server/default/conf directory. 2. Change the port number in the following line to the desired port number: 3. Save the file and restart the server. Zoho Corp.
ManageEngine Firewall Analyzer :: User Guide Installing and Uninstalling Firewall Analyzer is available for Windows and Linux platforms. It is available both in 32 Bit version and 64 Bit version. Installation Procedure for various OS and CPU versions: • • • • Windows 64 Bit version Windows 32 Bit version Linux 64 Bit version Linux 32 Bit version For more information on supported versions and other specifications, look up System Requirements.
ManageEngine Firewall Analyzer :: User Guide Linux: Linux 64 Bit version: The Firewall Analyzer Linux 64 Bit version download is available as a BIN file at http://manageengine.com/products/firewall/download.html Linux 32 Bit version: The Firewall Analyzer Linux 32 Bit version download is available as a BIN file at http://manageengine.com/products/firewall/download.html Rest of the installation procedure remains same for both 64 Bit and 32 Bit versions. 1.
ManageEngine Firewall Analyzer :: User Guide Starting and Shutting Down Once you have successfully installed Firewall Analyzer, start the Firewall Analyzer server by following the steps below.
ManageEngine Firewall Analyzer :: User Guide Linux: Navigate to the /bin directory and execute the run.sh file. As soon as this is done, a command prompt window opens showing startup information on several modules of Firewall Analyzer. Once all the modules have been successfully created, the following message is displayed: Server started.
ManageEngine Firewall Analyzer :: User Guide • • • • Right-click ManageEngine Firewall Analyzer 7, and select Stop in the menu. Alternatively, select Properties. The Properties screen opens up. In the General tab of the screen, check the Service status is "Started" and Stop button is in enabled state and other buttons besides are grayed. Click Stop button to stop the windows service. Linux: 1. Navigate to the /bin directory. 2. Execute the shutdown.sh file. 3.
ManageEngine Firewall Analyzer :: User Guide Accessing the Web Client Firewall Analyzer is essentially a firewall, VPN, and proxy server log analysis tool that collects, stores, and reports on logs from distributed firewalls, and proxy servers on the network. Once the server has successfully started, follow the steps below to access Firewall Analyzer. 1. Open a supported web browser window 2.
ManageEngine Firewall Analyzer :: User Guide License Information After you log in to Firewall Analyzer, click the Upgrade License link present in the topright corner of the screen. The License window that opens, shows you the license information for the current Firewall Analyzer installation.
ManageEngine Firewall Analyzer :: User Guide Getting Started Once Firewall Analyzer has been successfully set up and started in your network, the next thing you need to do is start sending logs to the Firewall Analyzer server. As soon as you log in, you will see the Dashboard. If no devices are sending logs to Firewall Analyzer, you will see a welcome screen, with options to help you get started.
ManageEngine Firewall Analyzer :: User Guide Using the Dashboard The Dashboard is shown when the Home tab is clicked. It is the first page you see when you log in. You can also customize your Dashboard Views as per requirements. Dashboard Views selection is available only in the Home tab. Once the server has started receiving records, the Dashboard dynamically changes to display the current statistics for each device whose log files are analyzed.
ManageEngine Firewall Analyzer :: User Guide you to watch the live syslogs from the filtered host and port. In the case, since you clicked from a specific device, the specific Firewall device information is loaded in to it by default. The fields of the syslog packets displayed are: Source, Destination, Port, and Message. Click the View Syslog link is provided in Home > Traffic Statistics > Device Name (besides the Proxy device). Ensure that the device has data for the selected calendar time range.
ManageEngine Firewall Analyzer :: User Guide complete details like Alert Profile name, the generated time, the device for which the alert was raised, the alert priority, and the status of the alert. The security statistics table provides you with the counts for Attacks, Virus, Failed Logons, Security Events, Denied Events, Config Changes and Compliance Reports. Attacks: Firewall Analyzer will recognize only those firewall log messages which contains the attribute denoting an attack.
ManageEngine Firewall Analyzer :: User Guide deleted from the database. Later if logs are received from that device, the device is added as a new device, and reports are generated. To stop this from happening, you need to configure the device to stop sending logs to Firewall Analyzer. Search Doing a search in Firewall Analyzer UI is easy. Firewall Analyzer offers both a Basic Search and Advanced Search in all the pages of the product.
ManageEngine Firewall Analyzer :: User Guide Search From In this section, you can select one from the two options: 1. Aggregated Logs Database 2. Raw Firewall Logs 3. Raw Proxy Logs 1. Aggregated Logs Database Select this option if you want to search from the aggregated logs database. 2. Raw Firewall Logs Select this option if you want to search from the raw firewall logs. Selecting this option will enable the following options: a. b. c. d.
ManageEngine Firewall Analyzer :: User Guide • • • If the search string exists then the search result will be intelligently displayed based on the report category in which it occurred. By default, the search is carried out for the time period selected in the Global Calendar present in the left pane of the UI. You can also search within the search results. Advanced Search of Imported Firewall Logs You can carry out Advanced Search on the imported Firewall logs. Zoho Corp.
ManageEngine Firewall Analyzer :: User Guide Using the Sub Tab The sub tab provides links to frequently accessed reports and tasks in Firewall Analyzer. It also shows the current server status using intuitive icons. The following reports can be generated by clicking the corresponding links in the sub tab: Link Interface/Zone Reports Application Action View live traffic reports for the past one day for each firewall, on a 5minute average.
ManageEngine Firewall Analyzer :: User Guide Icon Description 'Receiving Syslog Packets. _ packets received' message appears. Below that there is a Capture Filter : option with Host IP Address and Port. This capture filter will help you to watch the live syslogs from the filtered host and port. In the case, since you clicked from a specific device, the specific Firewall device information is loaded in to it by default. The fields of the syslog packets displayed are: Source, Destination, Port, and Message.
ManageEngine Firewall Analyzer :: User Guide Using The Left Navigation Pane The left navigation pane provides quick links to different tasks and reports in Firewall Analyzer. The components present in the left navigation pane depend on the tab that is currently selected. The following is a list of all components found in the left navigation pane: Component Dashboard Views Description List all the custom dashboard views created by the user. 'All Devices' view is the default dashboard view.
ManageEngine Firewall Analyzer :: User Guide Using Calendar You can use the calendar to select a single date or range of days to view various details of the reports, alerts, and logs of the Firewalls. There are two icons provided on top left corner of the calendar to select a single day or range of days. Refer the screen shot given below: Zoho Corp.
ManageEngine Firewall Analyzer :: User Guide Dashboard View Customization In the Dashboard Views section, you can see Customize link besides "Dashboard Views:" title to customize the dashboard view and a combo box listing all the available Dashboard Views with All Devices view on top. To customize the dashboard view, click Customize link. Dashboard View Customization page appears. It lists all the dashboard views available to the user including All Devices view on top.
ManageEngine Firewall Analyzer :: User Guide To delete a device view To delete a view, click the icon of the view to be deleted. Default View: The default dashboard view is the one which appears in the Home tab, upon user login. By default All Devices view is set as default view. User can create and set any view as default view. Default view will appear automatically only when the user closes the client and re-logs in.
ManageEngine Firewall Analyzer :: User Guide Firewall Analyzer Reports Firewall Analyzer offers a rich set of pre-defined reports that help in analyzing bandwidth usage and understanding network behavior. On a broad level, reports in Firewall Analyzer are classified into the following types: Report My Report Profiles Reports Across Devices Firewall Reports Squid Proxy Reports Trend Reports Description Create custom report profiles to report on specific parameters View bandwidth usage, protocol usage, etc.
ManageEngine Firewall Analyzer :: User Guide Firewall Reports Firewall Analyzer offers a rich set of pre-defined reports that help in analyzing bandwidth usage and understanding network behavior.
ManageEngine Firewall Analyzer :: User Guide Live Reports The Live Reports provide a live visual representation of the traffic load across network links. Graphs are similar to that of MRTG, with the aim of providing a simple way to see exactly how much inbound and outbound traffic was generated for each device. • • • Interface/Zone Reports For all devices Live Reports of Each Firewall Device Live Reports of Each Squid Device SNMP base Live report graphs are not available for virtual Firewalls (vdom).
ManageEngine Firewall Analyzer :: User Guide Enter the SNMP Community of the device in the text box Enter the SNMP Port of the device in the text box Enter the User Name of the device in the text box Enter the Context Name of the device in the text box Authentication: Select the Protocol for authentication from the drop down list (MD5, SHA). Enter the Password for authentication in the text box Encryption: Select the Protocol for encryption from the drop down list (DES, AES).
ManageEngine Firewall Analyzer :: User Guide By default User Input radio button is selected. If you want to manually enter the interface details, carryout in this screen as given below: In the User Input screen, Device Name, Interface Name will be displayed. Besides the name of the interface, edit icon. Click the icon to change the interface name as per your you will find requirement. The result will take effect immediately.
ManageEngine Firewall Analyzer :: User Guide The graphs for each device shows the minimum, maximum, and average amount of incoming and outgoing traffic through that device, over several time periods. Traffic is broken down into the last day, last week, last month, and last year, with an average granularity of 5 minutes, 30 minutes, 2 hours, and 1 day respectively. The incoming and outgoing bandwidth can be viewed in Kbps.
ManageEngine Firewall Analyzer :: User Guide Click on the PDF to export this report to PDF. Click on the CSV to export this report to CSV format (comma separated values). Click the Live Reports link present inside the list of reports for a device, to see the live reports for that device alone, over specific time periods. The graphs for each device shows the minimum, maximum, and average amount of outgoing traffic through that device, over several time periods.
ManageEngine Firewall Analyzer :: User Guide Application Reports The Application Reports are available only for Fortigate Firewalls. This section includes reports that help in monitoring the bandwidth consumed by the application accessed by user like Skype, Facebook, Youtube etc. Note: • • Ensure that the Fortigate Firewall has Application Control service to generate Application logs, which is for creating Application reports.
ManageEngine Firewall Analyzer :: User Guide The Top Hosts graph shows the top hosts contributing to application traffic to the firewall. The table below the graph shows the host name or IP address, along with the number of hits and the total bytes of traffic generated. The Top Protocols graph shows the top protocols contributing to application traffic to the firewall. The table below the graph shows the protocol, along with the number of hits and the total bytes of traffic generated.
ManageEngine Firewall Analyzer :: User Guide Traffic Reports The Traffic Reports section includes reports that show bandwidth usage based on the amount of traffic sent and received through the device. On the top right side of the Report screen, there will be three combo boxes. They are: • • • Top 5 Filter by Export as Top 5 The Top 5 combo box lets you choose the level of detail in the reports. By default, the top five values are shown. To show more than 15 values, the report uses only tables.
ManageEngine Firewall Analyzer :: User Guide graph shows the top hosts grouped by summing the number of bytes sent and received by each host. The table below each graph shows the host name or IP address, number of hits, and the number of bytes sent or received as applicable.
ManageEngine Firewall Analyzer :: User Guide Protocol Usage Reports The Protocol Usage Reports section includes reports that show bandwidth usage based on all the protocol groups generating traffic through the device. Separate reports are available for Web, Mail, FTP, and Telnet protocol groups. Click on the respective reports to view bandwidth usage details. On the top right side of the Report screen, there will be three combo boxes.
ManageEngine Firewall Analyzer :: User Guide Click on the PDF to export this report to PDF. Click on the CSV to export this report to CSV format (comma separated values). Click on the Protocol Groups link under the Settings tab to see what protocols fall under each protocol group, and how to edit them. The Top Protocol Groups - Sent and Top Protocol Groups - Received graphs show the top protocol groups sending and receiving data across the device respectively.
ManageEngine Firewall Analyzer :: User Guide graph shows the top users grouped by summing the number of bytes sent and received by each protocol group. The table below each graph shows the user name, the protocol used, number of hits, and the number of bytes sent or received as applicable.
ManageEngine Firewall Analyzer :: User Guide Web Usage Reports The Web Usage Reports section includes reports on the top protocols under the Web protocol group, that have been used to generate traffic through that device. On the top right side of the Report screen, there will be three combo boxes. They are: • • • Top 5 Filter by Export as Top 5 The Top 5 combo box lets you choose the level of detail in the reports. By default, the top five values are shown.
ManageEngine Firewall Analyzer :: User Guide Click on the PDF to export this report to PDF. Click on the CSV to export this report to CSV format (comma separated values). Click on the Protocol Groups link under the Settings tab to see what protocols fall under each protocol group, and how to edit them. The Top Protocols - Sent and Top Protocols - Received graphs show the top Web protocols sending and receiving data across the device respectively.
ManageEngine Firewall Analyzer :: User Guide The Top Rules table shows the top protocol groups triggering firewall rules, the rules that were triggered, and the hosts triggering the rules. Look up Managing Protocol Groups for help on adding, editing, and deleting protocol groups and protocols. Zoho Corp.
ManageEngine Firewall Analyzer :: User Guide Mail Usage Reports The Mail Usage Reports section includes reports on the top protocols under the Mail protocol group, that have been used to generate traffic through that device. On the top right side of the Report screen, there will be three combo boxes. They are: • • • Top 5 Filter by Export as Top 5 The Top 5 combo box lets you choose the level of detail in the reports. By default, the top five values are shown.
ManageEngine Firewall Analyzer :: User Guide Click on the Protocol Groups link under the Settings tab to see what protocols fall under each protocol group, and how to edit them. The Top Protocols - Sent and Top Protocols - Received graphs show the top Mail protocols sending and receiving data across the device respectively. The Top Protocols - Sent + Received graph shows the top protocols grouped by summing the number of bytes sent and received by each protocol.
ManageEngine Firewall Analyzer :: User Guide FTP Usage Reports The FTP Usage Reports section includes reports on the top protocols under the FTP protocol group, that have been used to generate traffic through that device. On the top right side of the Report screen, there will be three combo boxes. They are: • • • Top 5 Filter by Export as Top 5 The Top 5 combo box lets you choose the level of detail in the reports. By default, the top five values are shown.
ManageEngine Firewall Analyzer :: User Guide Click on the Protocol Groups link under the Settings tab to see what protocols fall under each protocol group, and how to edit them. The Top Protocols - Sent and Top Protocols - Received graphs show the top FTP protocols sending and receiving data across the device respectively. The Top Protocols - Sent + Received graph shows the top protocols grouped by summing the number of bytes sent and received by each protocol.
ManageEngine Firewall Analyzer :: User Guide The Top Rules table shows the top protocol groups triggering firewall rules, the rules that were triggered, and the destination and the number of hits. The Top URLs table shows the top URL's or web sites that were accessed using protocols in the FTP protocol group. Look up Managing Protocol Groups for help on adding, editing, and deleting protocol groups and protocols. Zoho Corp.
ManageEngine Firewall Analyzer :: User Guide Telnet Usage Reports The Telnet Usage Reports section includes reports on the top protocols under the Telnet protocol group, that have been used to generate traffic through that device. On the top right side of the Report screen, there will be three combo boxes. They are: • • • Top 5 Filter by Export as Top 5 The Top 5 combo box lets you choose the level of detail in the reports. By default, the top five values are shown.
ManageEngine Firewall Analyzer :: User Guide The Top Protocols - Sent and Top Protocols - Received graphs show the top Telnet protocols sending and receiving data across the device respectively. The Top Protocols - Sent + Received graph shows the top protocols grouped by summing the number of bytes sent and received by each protocol. The table below each graph shows the protocol name, number of hits, and the number of bytes sent or received as applicable.
ManageEngine Firewall Analyzer :: User Guide Event Summary Reports The Event Summary Reports section includes reports that show the summary of events generated by that device. On the top right side of the Report screen, there will be three combo boxes. They are: • • • Top 5 Filter by Export as Top 5 The Top 5 combo box lets you choose the level of detail in the reports. By default, the top five values are shown. To show more than 15 values, the report uses only tables.
ManageEngine Firewall Analyzer :: User Guide The Top Hosts graph shows the top hosts generating events along with the respective event severities. The table below the graph shows the host name or IP address, the event severity, the number of events, and the number of bytes of traffic generated.
ManageEngine Firewall Analyzer :: User Guide VPN Reports The VPN Reports shows usage statistics, protocols used, and other details across each VPN configured behind the firewall. On the top right side of the Report screen, there will be three combo boxes. They are: • • • Top 5 Filter by Export as Top 5 The Top 5 combo box lets you choose the level of detail in the reports. By default, the top five values are shown. To show more than 15 values, the report uses only tables.
ManageEngine Firewall Analyzer :: User Guide The VPN User Session Time Details table shows the VPN session time details of each user. The table contains the user names of the Users, Start Time, End Time and Duration of the VPN sessions. The Top VPN Users graph shows the top VPN users across all VPNs behind this firewall. The table below the graph shows each user, along with duration of the VPN connection, the number of hits, and the total bytes of traffic generated by each user.
ManageEngine Firewall Analyzer :: User Guide The Top VPN Clients graph shows the top clients accessing the VPN. The table below the graph shows the host names or IP addresses along with the number of hits, and the total bytes of traffic transferred by each client.
ManageEngine Firewall Analyzer :: User Guide The VPN Traffic Usage Trend graph shows the hourly trend in VPN traffic across all VPNs configured behind this firewall. The table below the graph shows the the number of hits, and the total bytes of traffic received and sent for each hour of the day by all the VPNs. Zoho Corp.
ManageEngine Firewall Analyzer :: User Guide Firewall Rules Report The Firewall Rules Report shows the top firewall rules triggered on this firewall, grouped by different categories. On the top right side of the Report screen, there will be three combo boxes. They are: • • • Top 5 Filter by Export as Top 5 The Top 5 combo box lets you choose the level of detail in the reports. By default, the top five values are shown. To show more than 15 values, the report uses only tables.
ManageEngine Firewall Analyzer :: User Guide rule, and the Count of log entries that have triggered the paritcular rule. Drill down from the rule to see the hosts, protocols, user, status, message, total bytes consumed by the rules and count that triggered the firewall rule. The drilled down report also displays the total bytes consumed by the rules. The Top Unused Rules table shows the Firewall rules that have not triggered. The table shows the Rule Number or ID of the unused rule.
ManageEngine Firewall Analyzer :: User Guide Inbound Outbound Reports The Inbound Outbound Traffic Reports section includes reports that show traffic details when inbound traffic (traffic coming into LAN) and outbound traffic (traffic going out of LAN) for the firewall, are separated. In order to separate inbound and outbound traffic, you need to first configure your intranets by clicking the Intranet Settings link from the Settings tab.
ManageEngine Firewall Analyzer :: User Guide Click on the PDF to export this report to PDF. Click on the CSV to export this report to CSV format (comma separated values). The Top Hosts - Inbound Firewall Traffic graph shows the top hosts contributing to traffic inbound (traffic coming into LAN) to the firewall. The table below the graph shows the host name or IP address, along with the number of hits and the total bytes of traffic generated.
ManageEngine Firewall Analyzer :: User Guide Intranet Reports The Intranet Reports section includes reports that show details of traffic transferred through the firewall by the internal hosts (hosts inside your LAN). In order to identify your internal hosts, you need to first configure your intranets by clicking the Intranet Settings link from the Settings tab. On the top right side of the Report screen, there will be three combo boxes.
ManageEngine Firewall Analyzer :: User Guide The Top Internal Hosts (Sent+Received) graph shows the top internal hosts that are sending and receiving traffic through the firewall. You can expect only IP's inside your LAN here. The table below the graph shows the IP address, along with the number of hits, bytes received, bytes sent, and the total bytes (sent + received) of traffic generated.
ManageEngine Firewall Analyzer :: User Guide Internet Reports The Internet Reports section includes reports that show details of traffic transferred through the firewall by the external hosts (hosts outside your LAN). In order to identify your external hosts, you need to first configure your intranets by clicking the Intranet Settings link from the Settings tab. When configured, all hosts outside your configured intranets will be considered as external hosts.
ManageEngine Firewall Analyzer :: User Guide Click on the PDF to export this report to PDF. Click on the CSV to export this report to CSV format (comma separated values). The Top External Hosts (Sent+Received) graph shows the top external hosts that are sending and receiving traffic through the firewall. Here you can expect only IP's outside your LAN.
ManageEngine Firewall Analyzer :: User Guide Streaming and Chat Sites Reports The Streaming and Chat Sites Reports section includes reports on streaming and chat sites visited. In order to identify your external hosts, you need to first configure your intranets by clicking the Intranet Settings link from the Settings tab. When configured, all hosts outside your configured intranets will be considered as external hosts. On the top right side of the Report screen, there will be three combo boxes.
ManageEngine Firewall Analyzer :: User Guide The Top Streaming and Chat Sites graph shows the top streaming and chat sites that are sending and receiving traffic through the firewall. Here you can expect only IP's outside your LAN. The table below the graph shows the IP address, along with the number of hits, bytes received, bytes sent, and the total bytes (sent + received) of traffic generated.
ManageEngine Firewall Analyzer :: User Guide Security Reports The Security Reports section includes reports that help in monitoring and analyzing the security and effectiveness of the firewall, and assist in identifying, tracking, and investigating potential security risks. On the top right side of the Report screen, there will be three combo boxes. They are: • • • Top 5 Filter by Export as Top 5 The Top 5 combo box lets you choose the level of detail in the reports.
ManageEngine Firewall Analyzer :: User Guide The Top Denied Hosts report shows the top source IP addresses or host names that have been denied requests for the selected time period. The Top Denied Destinations report shows the top destination IP addresses or host names that have been denied responses for the selected time period.
ManageEngine Firewall Analyzer :: User Guide Virus Reports The Virus Reports section includes reports that show details on viruses that have been identified by the firewall. These reports help in identifying the top viruses and worms that have affected the network, analyze the extent of damage, and also track the source of the attack. On the top right side of the Report screen, there will be three combo boxes.
ManageEngine Firewall Analyzer :: User Guide The Top Virus Sending Hosts report shows the top source IP addresses or host names from which viruses have been sent, along with the protocol used to send the virus. The Top Virus Affected Hosts report shows the top destination IP addresses or host names that have been affected by viruses, along with the protocol that was used to receive the virus.
ManageEngine Firewall Analyzer :: User Guide Field Subtype Time Message Description The subtype of the virus, as defined by the firewall The timestamp when the virus file was sent The virus message generated by the firewall The Top Virus Generator report shows the source of generation for each virus and their distinct targets.
ManageEngine Firewall Analyzer :: User Guide Attack Reports The Attack Reports section includes reports that show details of attacks that have been identified by the firewall. These reports help in identifying the top attackers, the top targets for the attacks and other details like protocol used, the priority of the attack and the status of the attack. On the top right side of the Report screen, there will be three combo boxes.
ManageEngine Firewall Analyzer :: User Guide The Top Attackers report shows the top source IP addresses or host names from which attacks are originating, along with the protocol used for the attack and the number of hits. The Top Targets report shows the top destination IP addresses or host names that have been attacked, along with the protocol used for the attack and the number of hits.
ManageEngine Firewall Analyzer :: User Guide Field Hits Subtype Time Status Message The The The The The Description number of times the attack file was sent to the same host subtype of the attack, as defined by the firewall time stamp when the attack file was sent status of the attack that was sent or received attack message generated by the firewall The Top Attacker by unique targets report shows peer to peer attack details.
ManageEngine Firewall Analyzer :: User Guide Spam Reports The Spam Reports section includes reports that show details on spams that have been detected by the firewall. These reports help in identifying the top spams that have affected the network, analyze the extent of damage, and also track the source of the spam attack. On the top right side of the Report screen, there will be three combo boxes.
ManageEngine Firewall Analyzer :: User Guide The Top Spam Generator report shows the source of generation for each spam with sender Email address and the number of times the spam was sent. In this report you will see the following details: Field Host Sender Hits Description The host or IP address that generates the Spam Sender Email address Number of spam mail sent Drilling down the graph or table will give destination of Email, recipient Email address.
ManageEngine Firewall Analyzer :: User Guide Admin Reports The Admin Reports is available only for Cisco PIX, NetScreen, FortiGate, and Identiforce Gateway . This section includes reports that help in monitoring and analyzing the firewall user access, and aid in meeting regulatory compliance requirements.. On the top right side of the Report screen, there will be three combo boxes. They are: • • • Top 5 Filter by Export as Top 5 The Top 5 combo box lets you choose the level of detail in the reports.
ManageEngine Firewall Analyzer :: User Guide Successfull User Logon report shows the users who have successfully logged-in to the firewall along with the count. Successfull User Logoff report shows the users who have successfully logged-out of the firewall along with the count. Denied User Logons report shows the users who have unsuccessfully attempted logging in to the firewall along with the count.
ManageEngine Firewall Analyzer :: User Guide URL Categories Reports The URL Categories Reports section includes reports on the categories of URL fetched from the Firewall logs. The logs contain the URL category information and the number hits on the URL categories. In the URL Categories Report: , the graph and the table lists the categories and the hits of Top Allowed Categories and Top Denied Categories.
ManageEngine Firewall Analyzer :: User Guide Click on the PDF to export this report to PDF. Click on the CSV to export this report to CSV format (comma separated values). The Category Drill Down Report lists the Top URLs, Top Sources and Top Destinations of a particular category. The Top URLs accessed under Category table lists the URLs accessed under the particular category. The table shows the list of URLs accessed under the particular category and the number of hits.
ManageEngine Firewall Analyzer :: User Guide Firewall Change Management Reports The Firewall Change Management Reports are available for all Firewall devices. Firewall Change Management Report keeps track of all the changes done to a Firewall configuration from the time the device is configured to be monitored by the Firewall Analyzer. It fetches Firewall device configuration using Telnet or SSH protocols.
ManageEngine Firewall Analyzer :: User Guide Startup-Running Conflict Report The changes between current versions of the Startup and running configuration files are displayed in this report. In this report also who, what, when and which questions are answered and the changes are marked in color. Select device reports > Change Management Reports > Startup-Running Conflict Report link to get the conflict report. Look at the screen shot of conflict report. Zoho Corp.
ManageEngine Firewall Analyzer :: User Guide Change Management Email Alert You can get a real time alert via Email or SMS when a configuration change is made. This will reduce your reaction time drastically to rectify any erroneous configuration. Have a look at the Email message. Zoho Corp.
ManageEngine Firewall Analyzer :: User Guide Context based Change Management Email Alert You can change the format of real time alert via Email or SMS when a configuration change is made. This can be configured in the Firewall Analyzer in the userConfig.do screen. Zoho Corp.
ManageEngine Firewall Analyzer :: User Guide Have a look at the Email message. Description of Startup and Running configuration The security appliance loads the configuration from a text file, called the startup configuration. When you enter a command, the change is made only to the running configuration in memory. You must manually save the running configuration to the startup configuration for your changes to remain after a reboot.
ManageEngine Firewall Analyzer :: User Guide Current Startup-Running Conflict Report The report will show the current conflicts between the startup and running configurations. • • The three configuration reports, Running Configuration Changes Report, Startup Configuration Changes Report, and Current Startup-Running Conflict Report are applicable only for Cisco devices. Only Running Configuration Changes Report is applicable for Netscreen and Fortigate devices.
ManageEngine Firewall Analyzer :: User Guide While fetching configuration from the device for the first time, Firewall Analyzer will not set any pager to get the complete configuration data at one shot. Once the configuration is fetched, the pager is set to default. The default value of pager settings are given below: • • • Cisco: 24 lines Netscreen: 20 lines Fortigate: No pager Report Filter links On the top right side of the Report screen, there will be three combo boxes.
ManageEngine Firewall Analyzer :: User Guide Proxy Reports Proxy Server Reports The Proxy Reports section in Firewall Analyzer includes reports that are based on proxy cache logs. This section can be accessed from the left navigation pane or the Reports tab. Squid is a widely used proxy cache for Linux and UNIX platforms. Squid is usually used together with a firewall to secure internal networks from the outside using a proxy cache.
ManageEngine Firewall Analyzer :: User Guide Live Reports The Live Reports provide a live visual representation of the traffic load across network links. Graphs are similar to that of MRTG, with the aim of providing a simple way to see exactly how much inbound and outbound traffic was generated for each device. • • • Interface/Zone Reports For all devices Live Reports of Each Firewall Device Live Reports of Each Squid Device SNMP base Live report graphs are not available for virtual Firewalls (vdom).
ManageEngine Firewall Analyzer :: User Guide Enter the SNMP Community of the device in the text box Enter the SNMP Port of the device in the text box Enter the User Name of the device in the text box Enter the Context Name of the device in the text box Authentication: Select the Protocol for authentication from the drop down list (MD5, SHA). Enter the Password for authentication in the text box Encryption: Select the Protocol for encryption from the drop down list (DES, AES).
ManageEngine Firewall Analyzer :: User Guide By default User Input radio button is selected. If you want to manually enter the interface details, carryout in this screen as given below: In the User Input screen, Device Name, Interface Name will be displayed. Besides the name of the interface, edit icon. Click the icon to change the interface name as per your you will find requirement. The result will take effect immediately.
ManageEngine Firewall Analyzer :: User Guide The graphs for each device shows the minimum, maximum, and average amount of incoming and outgoing traffic through that device, over several time periods. Traffic is broken down into the last day, last week, last month, and last year, with an average granularity of 5 minutes, 30 minutes, 2 hours, and 1 day respectively. The incoming and outgoing bandwidth can be viewed in Kbps.
ManageEngine Firewall Analyzer :: User Guide Click on the PDF to export this report to PDF. Click on the CSV to export this report to CSV format (comma separated values). Click the Live Reports link present inside the list of reports for a device, to see the live reports for that device alone, over specific time periods. The graphs for each device shows the minimum, maximum, and average amount of outgoing traffic through that device, over several time periods.
ManageEngine Firewall Analyzer :: User Guide Top Talkers The Top Talkers section includes reports that show the top hosts and protocols generating traffic through the proxy server. On the top right side of the Report screen, there will be three combo boxes. They are: • • • Top 5 Filter by Export as Top 5 The Top 5 combo box lets you choose the level of detail in the reports. By default, the top five values are shown. To show more than 15 values, the report uses only tables.
ManageEngine Firewall Analyzer :: User Guide below the graph shows the host name, IP address, or user name of the source, along with the protocol used, the number of hits, and the total traffic in bytes. The Top WAN Hosts and the Top WAN Users graphs show the respective top hosts and top users whose requests could not be processed by the proxy cache.
ManageEngine Firewall Analyzer :: User Guide Website Details The Website Details section includes reports that show the top domains, web sites, and web pages that were accessed using the proxy server. On the top right side of the Report screen, there will be three combo boxes. They are: • • • Top 5 Filter by Export as Top 5 The Top 5 combo box lets you choose the level of detail in the reports. By default, the top five values are shown. To show more than 15 values, the report uses only tables.
ManageEngine Firewall Analyzer :: User Guide The Top Web Sites report lists the top web sites that were accessed through this proxy server. This report classifies web sites based on the number of bytes that were transferred by a single user.
ManageEngine Firewall Analyzer :: User Guide Proxy Usage The Proxy Usage section includes information about the cache usage and proxy usage of the proxy server. On the top right side of the Report screen, there will be three combo boxes. They are: • • • Top 5 Filter by Export as Top 5 The Top 5 combo box lets you choose the level of detail in the reports. By default, the top five values are shown. To show more than 15 values, the report uses only tables. There is an option to display the Graph only.
ManageEngine Firewall Analyzer :: User Guide are trying to access unauthorized resources, or are simply unaware of present network security policies. Drill down from this graph to see the following details: Report Top Hosts Top Web Pages Description The top hosts and users that triggered this cache result code The top web pages that triggered this cache result code The Proxy Usage - Peer Status Code report shows the top peer status codes triggered.
ManageEngine Firewall Analyzer :: User Guide Proxy Server - URL Categories Reports The URL Categories Reports section includes reports on the categories of URL fetched from the Proxy server logs. The logs contain the URL category information and the number hits on the URL categories. In the URL Categories Report: , the graph and the table lists the categories and the hits of Top Allowed Categories and Top Denied Categories.
ManageEngine Firewall Analyzer :: User Guide Click on the PDF to export this report to PDF. Click on the CSV to export this report to CSV format (comma separated values). The Category Drill Down Report lists the Top URLs, Top Sources and Top Destinations of a particular category. The Top URLs accessed under Category table lists the URLs accessed under the particular category. The table shows the list of URLs accessed under the particular category and the number of hits.
ManageEngine Firewall Analyzer :: User Guide Trend Reports Trend Reports analyze traffic over several time periods and present graphs that make analysis and forecasting a lot easier. Firewall Analyzer includes trend reports based on traffic generated, protocols used, and events triggered. Trend reports compare the current trend with the historical trend on an hourly, daily, and weekly basis. Historical trends show data from the time the server was started.
ManageEngine Firewall Analyzer :: User Guide Protocol Trend Reports The Protocol Trend Reports section includes reports that show trends in the amount of traffic generated using different protocol groups. Protocol trends help in identifying peak usage times for each protocol group, understanding user trends, and enforcing better policies to allow traffic from each protocol group. On the top right side of the Report screen, there will be a drop down menu.
ManageEngine Firewall Analyzer :: User Guide Traffic Trend Reports The Traffic Trend Reports section includes reports that show trends in the amount of traffic generated across the firewall. Traffic trends help in understanding peak usage times, enforcing better security policies, and planning for effective bandwidth upgrades.
ManageEngine Firewall Analyzer :: User Guide Event Trend Reports The Event Trend Reports section includes reports that show trends in the number of events generated across the firewall. Event trends help in identifying malfunctioning hosts and malevolent systems, that eventually lead to enforcing better security policies, and increasing network perimeter security. On the top right side of the Report screen, there will be a drop down menu.
ManageEngine Firewall Analyzer :: User Guide VPN Trend Reports VPN trends help in identifying VPN connections spread over a time period for a particular device, that eventually lead to better planning of VPN policies, and increasing the VPN usage efficiently. The VPN Trend Reports section includes reports that show trends in the number of VPN users connecting across the Firewall/Concentrator. The VPN Trend Report consists of two parts.
ManageEngine Firewall Analyzer :: User Guide The Last 30 Days VPN Trend report compares the number of VPN user connections across this firewall over the past 30 days, with the date at the X axis of the graph always representing the last 30 days prior to the current date. The Last Year VPN Trend report compares the number of VPN user connections across this firewall over the past 12 months, with the month at the X axis of the graph always representing the last 12 months prior to the current month.
ManageEngine Firewall Analyzer :: User Guide Custom Reports Creating Report Profiles Custom reports in Firewall Analyzer are grouped into report profiles, and listed under the My Reports category. A report profile can contain a combination of pre-defined and custom reports. The My Reports section is present in the Reports tab and the left navigation pane. The My Reports section lists all the custom reports created so far, the hosts that are reported on, and scheduling options.
ManageEngine Firewall Analyzer :: User Guide Creating a Report Profile Click the Add Report Profile link to create a new report profile. You can click this link from the sub tab, the left navigation pane, or the My Reports section in the Reports tab. Step 1: Select Devices and Filters 1. For Report Profile Name, enter a unique name for the report profile. 2. Select the 'Want to assign this profile to any 'Guest' privilege user' check box, if you want to assign this profile to a guest user to view.
ManageEngine Firewall Analyzer :: User Guide For the Daily schedules, if the option Run on Week Days is selected then the reports are run daily except on the weekends. For the Weekly or Monthly schedules, select the option Generate Report only for Week Days if you want to report on the events that occurred only on the week days and not report on events that occurred over the weekends.
ManageEngine Firewall Analyzer :: User Guide Setting Log Filters Include filters specify those criteria which the log data must meet in order to be included in the report. Exclude filters specify those criteria which the log data must meet in order to be excluded from the report. Apart from selecting specific filters to apply on a report, you can also add, select, edit, and delete filters in this step. Include and Exclude filters let you filter log data and show only specific details in the custom report.
ManageEngine Firewall Analyzer :: User Guide Removing a Filter: Remove icon to remove or delete an existing filter 1. Click the 2. Choose whether you would like to Remove filter from the list or Remove it completely 3. Remove filter from the list option will only remove the filter from this listing, but would still be available for selection. Remove it completely option will remove this filter permanently and affects all existing report profiles to which this filter is applied.
ManageEngine Firewall Analyzer :: User Guide Creating Custom Criteria Reports Firewall Analyzer lets you define custom criteria and set up new reports. These reports are added to the Available Reports list, in Step 2 of the Add Report Profile wizard. 1. In Step 2 of the Add Report Profile wizard, click the icon to add a new report 2. In the Define New Report popup window that opens, enter a unique name for the report in the Report Name field. 3.
ManageEngine Firewall Analyzer :: User Guide Using Advanced Search Firewall Analyzer provides advanced search feature. Advanced Search, offers numerous options for making your searches more precise and getting more useful results. It allows you to search from the Raw Firewall Logs. Using this feature, you will be able to save the search results as Report Profiles. This provides a simplified means to create very precise, selectively filtered and narrowed down Report Profiles.
ManageEngine Firewall Analyzer :: User Guide a. b. c. d. Raw Raw Raw Raw VPN Logs Virus/Attack Logs Device Management Logs Denied Logs Select the above logs options as per your requirement.
ManageEngine Firewall Analyzer :: User Guide Aggregated Logs Database Select Aggregated Logs Database radio button. In the Criteria section, select Match all of the following or Match any of the following to match all the criteria set or any of the criteria set and add or remove additional criteria using Add Criteria and Remove Criteria links and select Protocol is 'HTTP'. Click Search. Search results provide the Reports related to your search .
ManageEngine Firewall Analyzer :: User Guide Notifications Creating an Alert Profile An alert is triggered whenever an event matching a specific criteria is generated. An alert profile lets you define such specific criteria, and also notify you by email, when the corresponding alert is triggered. • • Creating New Alert Profile Example Alert Profile Creating a New Alert Profile Click the Add Alert Profile link to create a new alert profile.
ManageEngine Firewall Analyzer :: User Guide period. Custom Peiod selection will display _ Days, _ Hours, _ Mins fields besides the selection list. b. Anomaly Alert Profile type, can be selected when you would like to be notified of any abnormal behaviors or traffic anomalies. Anomaly reports can be used for Network Behavioral Analysis (NBA). i. Select Device(s) for which the alert needs to be triggered by selecting the Select All check box or selecting the check boxes of required devices. ii.
ManageEngine Firewall Analyzer :: User Guide You will get an email when the following example values are met in your Firewall Analyzer.
ManageEngine Firewall Analyzer :: User Guide You need to configure the mail server settings in Firewall Analyzer before setting up an email notification. 5. There is a provision to execute custom scripts, every time an alert matching this alert profile is triggered, select the Run Script checkbox. Enter Script Location section appears below the option. Specify the location of the script to be executed in the Location field. Alternatively, use the Browse button to locate the script.
ManageEngine Firewall Analyzer :: User Guide • • • • Destination Attack filter conditions are Is, Is Not, Contains, Starts With and Ends With. Enter the attack name for which you want the alert to be generated. Message filter conditions are Is, Is Not, Contains, Starts With and Ends With. Enter the message part or whole for which you want the alert to be generated. Severity filter conditions are Is, Is Not, Contains, Starts With and Ends With.
ManageEngine Firewall Analyzer :: User Guide • • • • • Protocol Destination User filter conditions are Is, Is Not, Contains, Starts With and Ends With. Enter user name for which you want the alert to be generated. Rule filter conditions are Is, Is Not, Contains, Starts With and Ends With. Enter rule name for which you want the alert to be generated. Message filter conditions are Is, Is Not, Contains, Starts With and Ends With. Enter the message part or whole for which you want the alert to be generated.
ManageEngine Firewall Analyzer :: User Guide VPN Report: • • • • In a period of 1 Hour, 2 Hours, 6 Hours, 12 Hours, 1 Day, 7 Days, 14 Days, 30 Days, This Week, This Month If Total Traffic, Sent Traffic, Received Traffic, Number of Hits, Duration of All, Any Source, Any Destination, Any Protocol exceeds _ MB, GB, KB or Times or secs, minutes, hours, days. create an Alert with Priority as - Priority of the alert can be High, Medium, or Low based on your requirement for notification.
ManageEngine Firewall Analyzer :: User Guide The mapping table of severity number and severity Severity Emergency Alert Critical Error Warning Notification Information Severity Number 0 1 2 3 4 5 6 Zoho Corp.
ManageEngine Firewall Analyzer :: User Guide Viewing Alerts After setting up an Alert Profile, select the Alerts tab to see the list of alerts triggered. By default, the Alerts tab lists all the alerts triggered so far. The list shows the timestamp of the alert, the host which triggered it, the alert priority, and the status of the alert. Clicking on each alert profile would provide the details of the alert like why, when, & for which device the alert was triggered.
ManageEngine Firewall Analyzer :: User Guide Alerts Administration Select the Alerts tab to see the list of alerts triggered. By default, the Alerts tab lists all the alerts triggered so far. The triggered alerts can be administered by the users of Firewall Analyzer application. This topic explains the following sub-topics of alert administration. • • • • All Alerts Administering Alerts Alert Actions My Alerts The administrator or operator can keep track of the actions taken on a particular alert.
ManageEngine Firewall Analyzer :: User Guide The Alert Details are: Criticality - the alert priority (high, medium, low) which was set as per requirement at the alert profile creation time the host which triggered the alert. Last Event Message - the last event (type) message, which triggered the alert notification. Alert Profile Name - the name of the alert profile which triggered this alert. Besides the name, there is a link named "View all the alerts generated by this profile".
ManageEngine Firewall Analyzer :: User Guide System Settings Configuring System Settings The Settings tab lets you configure several system settings for the server running Firewall Analyzer, as well as other settings. The Simulate option sends sample firewall logs to Firewall Analyzer so that you can view reports without having to send actual firewall logs. At any time, click the Stop Simulate link to stop sending sample data.
ManageEngine Firewall Analyzer :: User Guide Setting External Authentication Settings Mail Server Settings Description Click this link to configure Active Directory and RADIUS server authentication Click this link to configure the mail server Click this link to configure to trigger alerts if there was no logs Firewall Availability Alert from Firewalls for a specifc period of time Click this link to view system-related information for Firewall Server Diagnostics Analyzer Database Console Click this link to
ManageEngine Firewall Analyzer :: User Guide Simulating Firewall Logs The Simulate option lets you test Firewall Analyzer with sample data before setting it up on your network. The sample data is taken from the firewall_records.xml file present in the /server/default/conf directory on the server. The Simulate option lets you view reports for firewalls only, and not squid proxy servers.
ManageEngine Firewall Analyzer :: User Guide Configuring Data Storage Duration Firewall Analyzer retains the Firewall log data in the database as well as archives the logs received from each Firewall device, and zips them in regular intervals. The Archived Files page displays files that have been archived for each device. Perpetual retention of data in the database as well as archives use a lot disk space.
ManageEngine Firewall Analyzer :: User Guide The data retention configurations available are described below: Configuration Default Value Database Log Archive 1 Year 1 Year The time period options are described below: Time period 1 Year 6 Months 3 Months 2 Months 1 Month 1 Week Description The log data will be retained for a period of 1 year and will be purged (from database/archive) after the time period.
ManageEngine Firewall Analyzer :: User Guide Managing Syslog Servers The Syslog Server Settings page lets you manage the various virtual syslog servers set up to receive exported logs at different ports. The default listener ports for the syslog server in Firewall Analyzer are 514 and 1514. If your firewalls are exporting log files to either of these ports, you do not have to set up any virtual syslog servers.
ManageEngine Firewall Analyzer :: User Guide Managing LEA Servers The CheckPoint Firewall Settings link lets you manage the LEA servers (CheckPoint Management Servers) that have been configured to connect to Check Point firewalls and access the log files. The list of LEA servers (CheckPoint Management Servers) configured, along with the respective LEA listener port and authentication details, is displayed. The details of the CheckPoint Firewalls are listed in a table.
ManageEngine Firewall Analyzer :: User Guide • Once saved, create a support information file through Support tab, and send to fwanalyzer-support@manageengine.com The Configuring Check Point Firewalls section includes detailed instructions on configuring Check Point firewalls for reporting in Firewall Analyzer Zoho Corp.
ManageEngine Firewall Analyzer :: User Guide Managing Alert Profiles The Alert Profiles link lets you manage all the alert profiles set up so far. • • • The Add Alert Profile link lets you create a new alert profile. The Export Alert Profile link lets you to export the existing alert profiles to use it afterwards. The Import Alert Profile link lets you to import the alert profiles saved using Export Alert Profile.
ManageEngine Firewall Analyzer :: User Guide cancel the import profiles operation. If the report already exist in Firewall Analyzer, clicking Import button will list Failed To Import option and the existing reports with check boxes and you will find Over Write button and Cancel button to cancel the import profiles operation. Select the check boxes of report profiles to overwrite and click Over Write button. There will be no hosts configured for the imported alert profiles.
ManageEngine Firewall Analyzer :: User Guide Configuring DNS Resolution Firewall Analyzer by default displays the IP addresses of the Source and Destination that participate in the conversation going through Firewall. It also has the option to resolve the IP addresses to DNS names (whichever could be resolved) in the individual reports. You can do it by clicking Resolve DNS link that is provided in the report page.
ManageEngine Firewall Analyzer :: User Guide Description of the options • Do Reverse lookup automatically. I want to see DNS name everywhere instead of IPAddress. In this option, Firewall Analyzer will perform reverse NS lookup of all IP addresses automatically. This will be carried out for all the reports and the only DNS names (whichever could be resolved) will be displayed in the reports. Use this option, if you want to see only DNS names of the hosts in all your reports.
ManageEngine Firewall Analyzer :: User Guide Mapping User Name vs IP Address using DHCP/Proxy Logs Firewall Analyzer by default displays the IP addresses of the Source and Destination that participate in the conversation going through Firewall. It provides you with an option to associate the IP addresses to User Name or MAC Address in the Firewall reports. The user name/Mac address to IP address can be mapped using DHCP or Proxy logs.
ManageEngine Firewall Analyzer :: User Guide The details of the columns of the table are: Proxy Server Details • • Description Proxy Server Name The names of the proxy server from which the Firewall Analyzer will associate user name with the Firewall log data. In this case, all the Proxy servers added to the Firewall Analyzer will be listed. Assigned Devices The Firewall devices assigned to the particular proxy server.
ManageEngine Firewall Analyzer :: User Guide • click Save button to save the settings. Below the selected option, you will find an option Add DHCP Servers as separate device with a check box. Select this option if you want to enable Raw Log Search over DHCP Logs. Import the DHCP logs. o Import DHCP logs if DHCP server is running in Windows. o Use Syslog daemon option available in your Linux box or Use Remote Import option with Periodic Interval.
ManageEngine Firewall Analyzer :: User Guide • Go to User-IP Mapping Configuration page and associate the Firewalls to detected DHCP server. In that page, below the selected option, you will find a table with DHCP server and devices to be assigned or assigned to it. The details of the columns of the table are given below: DHCP Server Details Description DHCP Server Name The names of the DHCP server from which the Firewall Analyzer will associate user name with the Firewall log data.
ManageEngine Firewall Analyzer :: User Guide • • • Click the Assign/Edit Devices icon to assign devices to the DHCP server. The Assign Devices screen pops up. o Select the devices, which you want to assign/re-assign to the selected DHCP server. All the available devices are listed in the Available Device(s) list. Select the devices and click right arrow. The selected devices are moved to the Selected Device(s) list.
ManageEngine Firewall Analyzer :: User Guide Importing Log Files The Import Log Files link lets you import a log file from the local machine or remotely, through FTP. The Imported Log Files page shows you the list of log files imported, along with details such as the host from which it was imported, and the status of the import. Importing of archived files (.gz format) created by Firewall Analyzer and zipped log files (.zip format) are also supported.
ManageEngine Firewall Analyzer :: User Guide a. Enter the remote host's HostName or IP address in the Remote HostName/IP text box, and the FTP user name and password in the Remote Username and Remote Password text boxes. b. Enter the Time Interval (Scheduling time in Minutes) after which Firewall Analyzer should retrieve new log files. c. Select the Ignore UnParsed/Junk Record(s) option as per requirement. d.
ManageEngine Firewall Analyzer :: User Guide Enable 'Remember this decision' and click 'Allow' • • If you have selected the Ignore UnParsed/Junk Record(s) while importing the logs, the records will not be shown when the icon is clicked on the sub tab. Microsoft ISA Proxy creates log file with new name (with time stamp appended) everyday.
ManageEngine Firewall Analyzer :: User Guide The number of imported log files listed per page can be selected in View per page: list (5, 10, 20. 50, 100). HTTP is displayed in the Protocol column, if logs have been imported from the local machine. FTP is displayed in the Protocol column, if logs have been imported from a remote machine. Click the FTP link to see the remote host details toggle icon in the Action column to and file details for the log file imported.
ManageEngine Firewall Analyzer :: User Guide Viewing Device Details The Device Details link shows you the various devices from which logs are collected in Firewall Analyzer. The Supported Logs Received table shows all the devices from which logs supported by Firewall Analyzer, are received. The table list the device details like Device Name, Device Type (Firewall, Squid, etc.
ManageEngine Firewall Analyzer :: User Guide Archiving Log Files Firewall Analyzer archives the logs received from each device, and zips them in regular intervals. The Archived Files page files that have been archived for each device, along with options to load the file to search, and delete the file. Encrypting Archived Log files Firewall Analyzer encrypts the log archive files to ensure the log data is secured for future forensic analysis and internal audits.
ManageEngine Firewall Analyzer :: User Guide You will find Edit Search Criteria link to edit and modify the search criteria. On clicking the link, you will find Device Name pix501(non-editable), Search Time From: <> To: <>. Next there will be two tabs: Search Traffic Logs and Search Security Logs. Choose one of the tabs as required.
ManageEngine Firewall Analyzer :: User Guide The archiving options available are described below: Attribute File Creation Interval Zip Compression Interval Start Initial Compression at Default Value 12 hours 24 hours _ Hrs _ Mins Retain logs for Forever Archive File Encryption Disable Time Stamping Disable Change Raw Logs Archive Location \server\default\archive directory Change Raw Logs Indexing Location \server\default\indexes directory Descripti
ManageEngine Firewall Analyzer :: User Guide Configuring to Fetch Firewall Configuration and Unused Rules In a Firewall device, there could be numerous rules/access-list defined to secure the network from external attacks. Out of the rules/access-list configured, there could be certain rules which would be most used and certain which are least used or never used. Firewall Analyzer captures the most used rules in the Top Used Rules as they would be available in the logs generated by Firewall.
ManageEngine Firewall Analyzer :: User Guide Fetch Rules/Config > From Device You can configure the individual device credentials to fetch the rules and configuration from the device or you can create a common profile of device credential which can be used for a group of devices to fetch rules. 7. In the From Device tab, select the protocol (Telnet or SSH) in the Protocol drop down list. 8. In the Use Profile tab, select the profile in the Use Profile drop down list.
ManageEngine Firewall Analyzer :: User Guide Device Info Description IP Address IP Address of the Firewall device to which the Firewall Analyzer will connect through FTP. See Note below. Port (Telnet/SSH) Port number of Telnet/SSH - 23 (for Telnet) and 22 (for SSH) by default. Login Prompt The text/symbol that appears on the console to get the typed login name is referred as login prompt. For example, Login: Password Prompt The text displayed on the console when asking for password.
ManageEngine Firewall Analyzer :: User Guide configure mail server for Firewall Analyzer. Select the schedule for report generation using the Get Report for Every <1 to 31> day(s) @ <0 to 23> Hrs <0 to 50> Min. (For example: If you configure like Every 10 day(s) @ 2 Hrs 30 Min, the reports will be generated for the device, every 10 days at 02:30 AM), For the for the selected duration.
ManageEngine Firewall Analyzer :: User Guide Fetch Rules > From File 12. In the From File tab, you will find the two options: Import Rule File and Import Configuration File. 13. In the Import Rule File option, click the Browse button to locate the file which contains the rules details of the Firewall device. 14. In the Import Configuration File option, click the Browse button to locate the file which contains the complete configuration details of the Firewall device. 15.
ManageEngine Firewall Analyzer :: User Guide ensure the correctness of device info values, Firewall Analyzer provides the testing option. After entering the device info, you can test the values during which Firewall Analyzer will indicate if the values entered are valid. It will pinpoint the invalid values and you can carry out corrections accordingly. To test the validity of device info, follow the procedure given below: • After providing the device info, click Test Now button.
ManageEngine Firewall Analyzer :: User Guide Device Details Description count will show the details of the vdoms/contexts individually. Refer the screen shot below. Edit An icon to edit the details of the rules fetching info of the device. Click icon to edit the device info. View Rules An icon to view the rules fetched from the device. Click icon to view the device rules. Unused Rules An icon to view the rules fetched from the device, which were not used.
ManageEngine Firewall Analyzer :: User Guide c. d. e. Assign Profile Delete Profile List Device Info After creating and saving the Device Profile values through the Firewall Analyzer GUI, the profiles, edit option, view/associate profile with devices to fetch rules, is listed in the Device Profile Details table.
ManageEngine Firewall Analyzer :: User Guide Primary Info Device Info Description Login Name While establishing connection with a common set of devices, if the devices ask for a Login Name, set a value for this parameter. This parameter is Optional. Password To set the Password for accessing the common set of devices. Prompt The prompt that appears after successful login. When entering into privileged mode, some common set of devices require Enable UserName to be entered.
ManageEngine Firewall Analyzer :: User Guide Assign Profile Click the Assign Profile link to associate devices to device profiles to fetch the rules information from the devices. The Associate Profiles to Devices screen opens up. 1. In the Selected Profile combo box, select the profile to be associated with the devices. If there is no profile available or you want to create and use a new profile, click New Profile link besides the combo box. 2.
ManageEngine Firewall Analyzer :: User Guide Procedure to enable Nipper In the Compliance Report field, the following message appears: 'Unable to generate compliance report. Reason: Failed to locate Nipper. Click here to enable it'. What should I do? Supported Platform: • • • • Ubuntu 9.1.10 Fedora 12 OpenSuSE 11.2 CentOS 5.5 Prerequisite: The GNU/Linux platform requires Qt 4.5 to be installed. Your package manager system should automatically install this for you. Steps: 1.
ManageEngine Firewall Analyzer :: User Guide Diagnose Firewall Connections Firewall Analyzer allows you to diagnose the active connections passing through the firewall device. You can do it by clicking Diagnose Connections link that is provided in the Settings page. This feature is available only for Netscreen and Cisco devices. Firewall Analyzer uses Telnet/SSH protocol to login to the Firewall device and fetches the active connections passing through the Firewall.
ManageEngine Firewall Analyzer :: User Guide Specify the filter criteria to fetch the active connections from the Firewall device. To reduce the load on Firewalls, Firewall Analyzer does not fetch all connections. It fetches upto 1000 random connections. If the connections goes beyond 1000 in number it will indicate at the bottom of the connections table. You can add more criteria or redefine the criteria to reduce the results. 4. Click Fetch Connections to fetch the connections for diagnosis.
ManageEngine Firewall Analyzer :: User Guide Scheduling Reports Once you have created a custom report profile, you can set up schedules to run the report automatically at specified time intervals. You can also configure Firewall Analyzer to automatically email the report once it runs. Scheduled reports are generated and emailed only as PDF files. If you are viewing PDF reports on a Windows machine, make sure you have Adobe Acrobat Reader installed.
ManageEngine Firewall Analyzer :: User Guide For Daily, and Only once schedules, you can set the Only Working Hours, or Only NonWorking Hours. TimeFilter for Custom Hours, For the Daily schedules, if the option Run on Week Days is selected then the reports are run daily except on the weekends.
ManageEngine Firewall Analyzer :: User Guide Working Hour Configuration Here you can configure the Working and Non-Working hour patterns of your enterprise. This will help you to distinguish between the working and non-working hour firewall log trends. By default, 10 - 20 Hours are considered as Working Hours and the remaining hours are considered as Non working Hours. Two options are provided for configuring the working hour patterns.
ManageEngine Firewall Analyzer :: User Guide Report View Customization Here you can customize the device specific reports to be shown in Device Tree and the Reports page. For each of the selected device, you are provided with the option of selecting from the default Available Reports the most required list of reports and move it to the Selected Reports. And only these selected reports would be listed in the Device Tree and the Reports page for this device. You can customize images used in the PDF Reports.
ManageEngine Firewall Analyzer :: User Guide Rebranding Firewall Analyzer Web Client To customize the Firewall Analyzer Web Client follow the steps given below: 1. In the Firewall Analyzer web client, select the Settings tab. 2. In Settings screen, select the System Settings > Rebranding FWA Web Client link. Rebranding Firewall Analyzer Web Client page appears.
ManageEngine Firewall Analyzer :: User Guide Click Update to update the customized images/logos and strings/texts. Click Cancel to cancel the customizing the web client operation. • • • • You can customize ZohoCorp/ManageEngine images/links as per your requirement. Customization takes effect only for the changed images/links, else default images/links are retained. Size of new image should be of same size as the default image. Images with the following file extensions are only permitted: .jpg, .gif, and .
ManageEngine Firewall Analyzer :: User Guide Admin Settings Managing Protocol Groups A protocol group is a set of related protocols typically used for a common purpose. The Protocol Groups link lets you define protocols as well as protocol groups, so that you can identify traffic that is unique to your enterprise. Most of the common enterprise protocols are already included in Firewall Analyzer under appropriate groups.
ManageEngine Firewall Analyzer :: User Guide icon to add a new protocol identifier. Click the Add Protocol Identifier link or the And, to specify the range for the protocol identifier click the Add Protocol Identifier icon and specify the From Port & To Port of the protocol identifier, Range link or the and select between tcp or udp for the Layer 3 Protocol.
ManageEngine Firewall Analyzer :: User Guide How to group the unassigned Protocols Generally used protocols like Mail, Web, FTP, Telnet, etc., have been configured as Groups. However, the unknown protocols can be grouped as per your requirement. 1. Click on the 'Unassigned' in protocol group under Traffic Statistics, which shows all the unknown protocols. 2. Click on Assign and Select 'All' under Hits and select the 'Multiple Selection', which lists all the unassigned protocols. 3.
ManageEngine Firewall Analyzer :: User Guide Setting up Intranets Firewall Analyzer includes the option to specify networks, or a range of IP addresses to identify machines behind a firewall. This setup is identified as the Intranet. By adding the machines or IP addresses that are located within your network (LAN), you can identify and distinguish between traffic that is generated within your network, and traffic that is coming from, or destined outside your network.
ManageEngine Firewall Analyzer :: User Guide Adding Different Users Click the User Management link to create and manage the different users who are allowed to access the Firewall Analyzer server.
ManageEngine Firewall Analyzer :: User Guide Delete Select all users check box if you want to delete all the users and individual user(s) check boxes to delete the selected users. There is a check box against each user below the all user check box. Click Delete button to delete all the or selected user(s) from the list of users accessing Firewall Analyzer. Assign Role Select the users for whom the host group(s) need to be assigned/re-assigned.
ManageEngine Firewall Analyzer :: User Guide Editing User Details If you have logged in as an Administrator user, the User Management page lists all the users created so far. • • • Click the Edit link to edit the user details. You can change the access level, password, and optionally, the default e-mail address for this user. You can edit the host groups associated with the user. Select the host group to which the user will be having access.
ManageEngine Firewall Analyzer :: User Guide Sl No Feature Name Administrator Operator Guest all users. himself. assigned to him. 3 Alert Profiles and Alert Administration The user can perform Add/Edit/Delete operation of Alert profiles created by all users. Administration of Alerts created by All Alert Profiles The user can perform Add/Edit/Delete operation of Alert profiles created by himself.
ManageEngine Firewall Analyzer :: User Guide Sl No Feature Name • Administrator Operator Guest Settings Database Console Configuration views present in the Settings Tab. 10 • • • • • Device Details Archived Files Protocol Groups Server Diagnostics Account Settings Yes Yes The user can view all the Configuration settings except Archive Settings and Server Diagnostics. Yes Yes No User Assistance 11 • • • • • Tell a Friend Upgrade License Help Feedback About Zoho Corp.
ManageEngine Firewall Analyzer :: User Guide Setting up the Mail Server You need to configure the mail server on Firewall Analyzer in order to receive email alert notifications and scheduled reports. Click the Mail Server Settings link to edit the mail server settings. Enter the following details: Field Description Outgoing Server Name Enter the name of the SMTP server on your network which is used for outgoing emails. Port Enter the port used by the SMTP server. Usually this is 25.
ManageEngine Firewall Analyzer :: User Guide External Authentication Settings Firewall Analyzer provides two more external authentication apart from the local authentication. They are Active Directory authentication and Remote Authentication Dial-in User Service (RADIUS) authentication. If you import users from Active Directory or if you add a RADIUS server details, you will find the Options >> link besides the Login button in the Firewall Analyzer Client UI Login screen.
ManageEngine Firewall Analyzer :: User Guide Import users from Active Directory In this section, you will find Import Users button. Click the button and Import users from Active Directory screen pops-up. In that screen, you will find the following items: • Domain Name combo box & Rescan Network link Domain Name combo box will list all the available domains in the network. Besides the combo box, you will find the Rescan Network link.
ManageEngine Firewall Analyzer :: User Guide RADIUS Server Configuration Settings You can also leverage the RADIUS authentication for user access bypassing the local authentication provided by Firewall Analyzer. In the RADIUS server authentication the users credentials are sent to the RADIUS server. The server checks for the user credentials and sends the authentication successful message to Firewall Analyzer server.
ManageEngine Firewall Analyzer :: User Guide RADIUS Server Settings Description • MSCHAP2 - Version 2 of Microsoft Challenge-Handshake Authentication Protocol Radius Server Secret The secret string used for connecting RADIUS client (Firewall Analyzer) with the server. Enter the RADIUS secret used by the server for authentication Authentication Retries The number of retries the RADIUS server to permit for authenticating users.
ManageEngine Firewall Analyzer :: User Guide Setting up the Mail Server You need to configure the mail server on Firewall Analyzer in order to receive email alert notifications and scheduled reports. Click the Mail Server Settings link to edit the mail server settings. Enter the following details: Field Description Outgoing Server Name Enter the name of the SMTP server on your network which is used for outgoing emails. Port Enter the port used by the SMTP server. Usually this is 25.
ManageEngine Firewall Analyzer :: User Guide Configuring Firewall Availability Alerts In Firewall Analyzer, alert can be triggered, if the Firewall stopped sending the logs. The alert triggering is configurable. Firewall non-availability alert configuration notifies the user through e-mail, when the Firewall Analyzer is not receiving logs from firewall(s). Follow the procedure given below to configure the triggering of alert: • • Select the Settings tab in the Web Client.
ManageEngine Firewall Analyzer :: User Guide If the Mail Server is not configured the following note appears and there is a link provided to configure the Mail Server. Configure the Mail Server in order to get the mail alerts. Note: Mail Server is not configured. Click here to configure the Mail Server. Select the SMS check box. Enter the mobile phone number in the SMS To text box, to which the alert has to be sent. Enter multiple phone numbers separated by a comma(,).
ManageEngine Firewall Analyzer :: User Guide Viewing Server Diagnostics Click the Server Diagnostics link to see server-specific device information. This information will be useful while troubleshooting the server or reporting a problem. The various information boxes on this page are described in the table below: Box Description License Information This box shows details about the license that is currently applied.
ManageEngine Firewall Analyzer :: User Guide Accessing the Database Firewall Analyzer lets advanced users access the in-built database and run standard queries. Click the Database Console link to open the Database Console page. In the prompt window displayed, enter the query to be executed. Remember the following when executing a query: • • Table names and table columns are case-sensitive. For SELECT queries, set the row limit between 1 and 500. Default row limit is 10.
ManageEngine Firewall Analyzer :: User Guide License Management - Manage/Unmanage Devices Firewall Analyzer offers a powerful and rich feature to manage and unmanage the devices. It offers a greater degree of flexibility to manage the number of devices that can be monitored by using Firewall Analyzer. Click the Settings > Admin Settings > License Management link to manage/unmanage/delete devices. On clicking the link License Management page opens up.
ManageEngine Firewall Analyzer :: User Guide device(s) or select all devices to delete. Click the Delete button. The selected device will be deleted. You can select multiple devices and manage/unmanage/delete them. If you want to monitor Firewall device in High Availability mode, ensure that Firewall Analyzer is bound to one source (that is a single IP Address/host name), then that source is considered as one device license.
ManageEngine Firewall Analyzer :: User Guide SMS Settings The SMS setting is similar to Mail Server setting. You need to configure the SMS settings in order to send SMS alert notifications to your cellular phone. This option is visible only for users with Admin and Operator access level Click the SMS Settings link under the Settings tab to configure the port in which the SMS equipment is connected and mobile phone number to test the functioning of port.
ManageEngine Firewall Analyzer :: User Guide Mobiles Supported S No Mobile Model Baud Rate 9600 Manufacturer 1 Motorola E398 Motorola 2 Nokia 6210 Nokia 3 Nokia 6310 Nokia 4 Nokia 6230i Nokia 5 Nokia 8250 Nokia 6 Nokia 6610 115200 Nokia 7 Nokia 7210 115200 Nokia 8 Sony Ericsson T610 19200 Sony Ericsson 9 Sony Ericsson W800i 115200 Sony Ericsson 10 samsung sgh-c100 9600 Samsung 11 Sharp GX30 115200 Sharp 12 Sony Ericsson k700 115200 Sony Ericsson 13 Motorola RAZR V
ManageEngine Firewall Analyzer :: User Guide Changing Account Settings Click the Account Settings link under the Settings tab to change the default password and e-mail address set for this account. You cannot change the account's user name or access level. Once you have made the required changes, click Save User Details to save the changes. Click Cancel to return to the default Settings tab. This option is visible only for users with Guest or Operator access level Zoho Corp.
ManageEngine Firewall Analyzer :: User Guide Configuring Firewalls Firewall Analyzer listens at the default ports for exported log files. The following is a list of firewalls and versions for which configuration instructions are included. Click the firewall name to see the corresponding configuration instructions.
ManageEngine Firewall Analyzer :: User Guide Configuring Check Point Firewalls Firewall Analyzer supports LEA support for R54 and above and log import from most versions. Determining the Check Point Version Number To determine the version number of the Check Point that you are running, use the following command: $FWDIR/bin/fw ver where $FWDIR is the directory where Check Point is installed. Pre-Requisites You need to do the following in Smart Dashboard of Check Point Firewall.
ManageEngine Firewall Analyzer :: User Guide The difference between the two ways are: If you configure LEA connection, the logs will be collected automatically and processed by the Firewall Analyzer. Whereas, if you want import the logs, manual intervention is required. You need to export the syslogs in Check Point Management Station or from Check Point Smart Tracker UI and then manually import the syslog file in Firewall Analyzer.
ManageEngine Firewall Analyzer :: User Guide lea_server port 0 lea_server auth_port 18184 2. Restart the firewall service [4.1] fwstop ; fwstart [NG] cpstop ; cpstart 3. Add a rule to the policy to allow the port defined above port 18184 (assuming default LEA connection port) from the Firewall Analyzer machine to the Check Point Management Server and vice versa. 4.
ManageEngine Firewall Analyzer :: User Guide Attributes OPSEC Application - SIC Name Description The SIC name of the OPSEC Application LEA client (the LEA Server on Firewall Analyzer), in the case of authenticated connections. LEA Server Authentication Type The authentication mechanism to be used. The default value is sslca.
ManageEngine Firewall Analyzer :: User Guide The above command creates an ascii file named exportresult.log. Copy or transfer this file to Firewall Analyzer machine. Then in Firewall Analyzer you can Import this log file. Method 2 : 1. In the Check Point Smart Tracker UI (UI where you are seeing all logs in Check Point Management Station), select All Records option in the left tree. 2. Click "File" > "Export". 3. Give a proper file name, like exportresult.log.
ManageEngine Firewall Analyzer :: User Guide Configuring NetScreen Firewall Firewall Analyzer supports most versions of NetScreen Firewall Appliance (OS 3.x, 4.x, 5.x,...). You can either enable WELF or Syslog format. Enable Syslog Messages and Disable WebTrends Messages using the NetScreen Administration Tools Console 1. Log in to the NetScreen GUI. 2. Click Configuration> Report Settings> Syslog in the left pane of the NetScreen GUI. 3. Select the Enable Syslog Messages check box. 4.
ManageEngine Firewall Analyzer :: User Guide Syngress > set webtrends host-name 10.23.23.
ManageEngine Firewall Analyzer :: User Guide • • Edit community to add SNMP Manager IP and the source interface (interface through which Firewall Analyzer connects firewall) to that community. Under communities section, you will find the option to edit community.
ManageEngine Firewall Analyzer :: User Guide Configuring Cisco Devices - PIX/ASA/FWSM/VPN Concentrator Firewall Analyzer supports the following versions of various Cisco devices. Cisco IOS Firewalls: • • • • • • • • • • 8xx 18xx 28xx 38xx 72xx 73xx 3005 1900 2911 3925 Cisco FWSM Catalyst Series: • • 6500 7600 Cisco PIX versions: • • 6.x 7.x Cisco ASA: 5500 series Cisco VPN Concentrators Series: • • 3000 3500 Model Family 8xx Model Cisco IOS Software Version c871, c876, c877,c878 12.
ManageEngine Firewall Analyzer :: User Guide To find out the version of your PIX firewall, Telnet to the PIX firewall and enter the show version command. Cisco PIX does not create log files, but instead directs a log stream to the syslog server, which writes the log information into a file. Make sure the syslog server on Firewall Analyzer can access the PIX firewall on the configured syslog port. For this, you may have to make a rule specific to this situation.
ManageEngine Firewall Analyzer :: User Guide where, interface_name syslog_ip 17/ hostname ipaddress interface_name string text context-name is the interface on the PIX firewall whose logs need to be analyzed ("inside" or "outside," for example). is the IP address of the syslog server (i.e. Firewall Analyzer), to which the Firewall should send the Syslogs. indicates that logs will be sent using the UDP protocol, to the configured syslog port on the syslog server.
ManageEngine Firewall Analyzer :: User Guide IP Address - the IP address of the syslog server to which logs have to be sent iii. Under Protocol, select the UDP radio button iv. The default UDP port is 514. If you have configured a different syslog listener port on your syslog server, enter the same port here. e. Click Apply 3. Configuring Logging Level a. Select Configure > Settings > Logging > Other b. Under Console Level List select Informational so that all report data is available c. Click Apply ii.
ManageEngine Firewall Analyzer :: User Guide interface_name syslog_ip udp/ hostname ipaddress interface_name string text context-name is the interface on the ASA Firewall whose logs need to be analyzed (for example: "inside" or "outside"). is the IP address of the syslog server (i.e. Firewall Analyzer), to which the Firewall should send the Syslogs. indicates that logs will be sent using the UDP protocol, to the configured syslog port on the syslog server.
ManageEngine Firewall Analyzer :: User Guide Configuration for SSL WebVPN in Cisco ASA appliance Firewall Analyzer requires syslog message IDs 722030 and 722031, which by default is at debug level, to process Cisco SVC VPN logs.
ManageEngine Firewall Analyzer :: User Guide (config-pmap-c)# flow-export event-type all destination • Option 2 If you wish to create a new policy map named netflow-export-policy and make this as your global policy follow the below steps: (config)# policy-map netflow-export-policy (config-pmap)# class netflow-export-class (config-pmap-c)# flow-export event-type any destination if the above command fails use the one below: (config-pmap-c)# flow-exp
ManageEngine Firewall Analyzer :: User Guide If you want to create a new SNMP community use the below command: configure terminal snmp-server community Example: configure terminal snmp-server community public Configuring Cisco VPN 3000 Concentrator Currently we support Cisco IOS Compatible Log Format and Original Log Format for Cisco VPN Concentrator.
ManageEngine Firewall Analyzer :: User Guide Use the following command: configure terminal 3. Enable logging by using the following commands: logging on logging trap informational logging 4. If there is a Firewall module in the IOS device, use the following command to enable audit trail. This will generate traffic information. ip inspect audit-trail For more information, refer the Cisco IOS Switch documentation.
ManageEngine Firewall Analyzer :: User Guide • • • • • value set in the Community String (default) field on the SNMP Management Stations pane is used In the SNMP Version drop-down list, choose the SNMP version used by the Firewall Analyzer If you have selected SNMP Version 3 in the previous step, in the Username drop-down list, choose the name of a configured user To specify the method for communicating with this management station, check the Poll check boxes Click OK.
ManageEngine Firewall Analyzer :: User Guide • • • Click OK to create a group (if this is the first user in that group), display this group in the Group Name drop-down list, and create a user for that group.
ManageEngine Firewall Analyzer :: User Guide Configuring Microsoft ISA Server Firewall Analyzer supports Microsoft Internet Security and Acceleration (ISA) Server 2000,2004, & 2006. Supported ISA Log Formats in Firewall Analyzer: Firewall Analyzer supports W3C extended log file format for Packet filters, ISA Server Firewall Service, and ISA Server Web Proxy Service. ISA Server File log format is supported for ISA Server Web Proxy Service only. Configuring Microsoft ISA Server 1.
ManageEngine Firewall Analyzer :: User Guide Configuring Microsoft ISA Server 2004 & 2006 By default Microsoft ISA Server 2004 & 2006 stores log files into MSDE databases (Microsoft SQL Desktop Engine).
ManageEngine Firewall Analyzer :: User Guide Configuring CyberGuard Firewall Analyzer supports CyberGuard Firewall v4.1, 4.2, 4.3, 5.1 Configuring CyberGuard On the Cyberguard Firewall Configuration console do the following. 1. 2. 3. 4. Click Configuration and select Alerts and Activities. Select Activity Reports in WebTrends format to send it via syslog. Select facility and severity. Type the Firewall Analyzer IP to which CyberGuard should write the syslog information.
ManageEngine Firewall Analyzer :: User Guide Configuring Cyberoam Firewall Analyzer supports Cyberoam Firewall Version: 9.5.4 build 66 onwards Configuring Cyberoam On the Cyberoam Firewall Web Admin Console do the following. 1. Select System > Logging > Manage Syslog 2. Specify unique name for Syslog server 3. Specify IP address and port of the syslog server. Cyberoam will send logs to the configured IP address. The default port is 514 4. Select Facility.
ManageEngine Firewall Analyzer :: User Guide • Click Save to save the rule. Zoho Corp.
ManageEngine Firewall Analyzer :: User Guide Configuring Fortinet Firewalls Firewall Analyzer supports the following versions of FortiGate: • • • FortiOS v2.5, 2.8, and 3.0 Fortinet - 50,100, 200, 300, 400, 800 Fortigate - 1000, 5000 series Firmware v2.26 or later is required Prerequisite to get Application report Information about Applications like Skype, FaceBook, YouTube and application categories accessed by users will be available in this report. This report is available for Fortigate only.
ManageEngine Firewall Analyzer :: User Guide Choose the logging level as Information or select the Log All Events checkbox (depending on the version of FortiGate) 4. If you want to export logs in the syslog format (or export logs to a different configured port): o Select the Log to Remote Host option or Syslog checkbox (depending on the version of FortiGate) Syslog format is preffered over WELF, in order to support vdom in Fortigate firewalls.
ManageEngine Firewall Analyzer :: User Guide set traffic enable set web enable set email enable set attack enable set im enable set virus enable end Type "show log syslogd filter" to list all available traffic. • Stop and start the Firewall Analyzer application/service and check if you are able to receive the Fortigate Firewall packets in Firewall Analyzer.
ManageEngine Firewall Analyzer :: User Guide Using Web UI: Log in to the FortiGate web interface Go to System > Config > SNMP v1/v2c Select Enable for the SNMP Agent Enter Description, Location and Contact information. Click Apply. • • • • • • • If you already have a SNMP community, edit it to provide Firewall Analyzer (SNMP Manager) IP address. Also specify the source interface through which Firewall Analyzer connects to Firewall.
ManageEngine Firewall Analyzer :: User Guide Configuring WatchGuard Firebox Firewall Analyzer supports both WELF and native log formats of WatchGuard Firebox Models v 5.x, 6,x, 7.x, 8.x, 10.x, 11, Firebox X series, x550e, x10e, x1000, x750e For 8.x version, the XML log file format can be imported by Firewall Analyzer. Virus reports are supported only for WatchGuard v10.
ManageEngine Firewall Analyzer :: User Guide Please refer the link of the forum post reply for your reference. http://www.watchguard.com/forum/default.asp?action=9&boardid=2&read=19115&fid=43 Please refer WatchGuard website/WatchGuard forums for detailed information. You can also configure WatchGuard to export the logs in WebTrends Enhanced Log File (WELF) format, refer WatchGuard documentation for configuring WELF format in WatchGuard Firewalls.
ManageEngine Firewall Analyzer :: User Guide Configuring Snort Firewall Analyzer supports most versions of Snort. Configuring Snort 1. Shutdown the Snort server, if it is running. 2. Login as root if you installed Snort in Linux machine. 3. In snort.conf file (available at /etc/snort/snort.conf in linux and c:\Snort\bin\snort.
ManageEngine Firewall Analyzer :: User Guide Configuring Secure Computing Sidewinder Firewall Analyzer supports Sidewinder G2. Configuring Sidewinder To Send Audit Data To Firewall Analyzer 1. Open /etc/sidewinder/auditd.conf 2. Add the following line at the end of the file, to configure syslog to use the Sidewinder Export Format (SEF): syslog (local0 filters[“NULL”] sef) You can use ‘local0’ through ‘local7’ as names for the facility; they are predefined in syslogd. 3.
ManageEngine Firewall Analyzer :: User Guide Configuring SonicWALL Internet Security Appliances Firewall Analyzer supports most of the versions of SonicWALL Firewall devices. Configuring SonicWALL To Direct Log Streams 1. 2. 3. 4. 5.
ManageEngine Firewall Analyzer :: User Guide Configuring Juniper Devices Firewall Analyzer supports the following Juniper devices. • • Juniper SRX Device (version SRX100, SRX210, SRX220, SRX240, SRX650, SRX1400, SRX3400, SRX3600, SRX5600, SRX5800) Juniper Networks IDP Device (version IDP 50) Configuring to send Syslog Messages from SRX device Using J-Web 1. 2. 3. 4. 5. 6. Log in to the Juniper SRX device. Click Configure > CLI Tools > Point and Click CLI in the Juniper SRX device.
ManageEngine Firewall Analyzer :: User Guide To enable logging for Security policy: Using J-Web • • • Select Configure > Security > Policy > FW Policies. Click on the policy for which you would like to enable logging. Navigate to Logging/Count and in Log Options, select Log at Session Close Time. Using CLI 1. Log in to the Juniper SRX device CLI console. 2. Execute the following command: user@host# set security policies from-zone trust to-zone untrust policy permit-all then log session-close Zoho Corp.
ManageEngine Firewall Analyzer :: User Guide Juniper Networks IDP Device (version IDP 50) Configuring to send Syslog Messages directly from Sensor 1. Log in to the Juniper Networks IDP device. 2. Click Device > Report Settings > Enable Syslog in the Juniper Networks IDP device. 3. Select the Enable Syslog Messages check box. 4. Click Apply to save the changes.
ManageEngine Firewall Analyzer :: User Guide This configuration will generate syslogs for: • • • • • All attacks Policy load Restart Profiler logs Device connect/disconnect logs This configuration will not provide: • • Interface UP/DOWN logs Logs for Bypass State Changes Zoho Corp.
ManageEngine Firewall Analyzer :: User Guide Configuring 3Com Firewall Analyzer supports the following 3Com Firewalls: • 3Com X Family devices Obtaining Log Information To create a Firewall Analyzer firewall profile, you must specify the log file location. 3Com firewalls do not create a log file. Instead, they direct a log stream to a syslog server which writes the log information to a file. Note: The ManageEngine Firewall Analyzer Server(s) can be anywhere on the Network.
ManageEngine Firewall Analyzer :: User Guide 6. Click Add to table below. 7. Click Apply. 8. Navigate to Firewall > Firewall Rules and click Create Firewall Rule. Complete the form as shown below. Zoho Corp.
ManageEngine Firewall Analyzer :: User Guide Note that later versions of TOS do not have separate checkboxes for Enable local logging and Enable syslog logging – they just have a checkbox for Enable logging which enables both. 9. Click Create. A new rule will be created at the bottom of the table. 10. Click Create Firewall Rule. Complete the form as shown below. 11. Click Create. A new rule will be created at the bottom of the table.
ManageEngine Firewall Analyzer :: User Guide 12. Click the pencil icon next to the first rule in the Firewall Rule table. This will open the rule for edit, as in the example below. 13. Click the Enable syslog logging checkbox as shown, then click Save. 14. Repeat steps 12 and 13 for all the Firewall Rules until syslog logging is enabled on them all.
ManageEngine Firewall Analyzer :: User Guide 6. Events will not be generated for “hidden” firewall rules. At the time of writing, there are two implicit “hidden” firewall rules that are not displayed but act as if they were the last two rules in the Firewall Rule table. These are: Permit from this-device to ANY zone ANY protocol Block from ANY zone to ANY zone ANY protocol These rules do not generate log entries or syslog messages.
ManageEngine Firewall Analyzer :: User Guide Configuring IPCop Firewalls Firewall Analyzer supports IPCop Firewall Version 1.4.17 / 1.4.18 Configuring IPCop To Send Audit Data To Firewall Analyzer 1. Open the Log Settings Administrative Web Page 2. Log Settings: This page allows you to control how the logs are displayed, specify the detail level and how long the log summaries are kept for, and control remote logging. 3.
ManageEngine Firewall Analyzer :: User Guide Configure Proxy Server Configuring Proxy Servers Firewall Analyzer listens at the default ports for exported log files. The following is a list of proxy servers and versions for which configuration instructions are included. Click the proxy server name to see the corresponding configuration instructions. Firewall Name Squid Proxy Server Version Numbers version 2.6 and above Zoho Corp.
ManageEngine Firewall Analyzer :: User Guide Configuring Squid Proxy Server For Squid v2.7 and above carry out the following configuration: Carry out the following changes in the services file: • • • Edit the services file in the /etc directory Check the port in the syslog server settings UDP 514/1514 is UP Save the file and exit the editor Device Side Configuration • Open the squid.
ManageEngine Firewall Analyzer :: User Guide Restart the syslog service on the host using the command: /etc/rc.d/init.d/syslog restart Configuring syslog-ng daemon in a Linux host • Append the following entries at the end of syslog-ng.conf file in the /etc/syslog-ng/ directory: destination firewallanalyzer { udp("" port(514)); }; log { source(src); destination(firewallanalyzer); }; where is the IP address of the machine on which Firewall Analyzer is running.
ManageEngine Firewall Analyzer :: User Guide Tips and Tricks Frequently Asked Questions For the latest list of Frequently Asked Questions on Firewall Analyzer, visit the FAQ on the website or the public user forums. General Product Information 1. Is a trial version of Firewall Analyzer available for evaluation? Yes, a 30-day free trial version can be downloaded from the website at http://www.fwanalyzer.com/ 2.
ManageEngine Firewall Analyzer :: User Guide 8. How secure is the data that is sent to the web browser over the Internet? Data sent from Firewall Analyzer is normally not encrypted and hence is readable if intercepted. 9. How do I buy Firewall Analyzer? You can buy Firewall Analyzer directly from the ZOHO Corp. Online Store, or from a reseller near your location. Please see the website at http://www.fwanalyzer.com/ for more information on purchasing options. 10.
ManageEngine Firewall Analyzer :: User Guide BackupDB.bat/.sh present in the /troubleshooting directory. 6. How to configure Firewall Analyzer as service in Linux, after installation? To configure Firewall Analyzer as service in Linux, after installation Normally, the Firewall Analyzer is installed as a service. If you have installed as an application and not as a service, you can configure it as a service any time later.
ManageEngine Firewall Analyzer :: User Guide 2. How do I configure my firewall's to produce WELF log files? Firewall's usually need to be configured specifically to generate log files in WELF. The Configuring Firewall's section includes configuration instructions for some of the firewall's supported by Firewall Analyzer. 3. My firewall cannot export logs.
ManageEngine Firewall Analyzer :: User Guide Note:Once you assign the protocols, the reports will show the assigned protocols and the newly assigned protocols under their appropriate protocol group only from the assigned time. You will see the unassigned protocols in the reports generated earlier to the assigned time. If you find that the reports based on ports, please assign specific protocols to the corresponding port numbers and create a custom report to view the details. Checking the port numbers 1.
ManageEngine Firewall Analyzer :: User Guide 7. Why don't trend reports take time values or top-n values into account? Trend reports show historical data for the corresponding traffic statistics shown in the report. Hence time changes from the Global Calendar, or top-n value changes from the Show bar on the report, do not affect these reports. 8. Why the Un-used Rules Report is empty? To view the "Un Used Rules Reports", you need to configure Firewall Analyzer to fetch rules from device via Telnet or SSH.
ManageEngine Firewall Analyzer :: User Guide 3. I am not getting Attack Reports in CheckPoint firewall? Firewall Analyzer looks for the attribute attack in the CheckPoint firewall logs to generate the attack reports. 4. Firewall Analyzer shows the destination site (example: www.yahoo.com) but it is not showing the complete URL (example: www.yahoo.com/index.html)? It looks for the attribute resource in the log.
ManageEngine Firewall Analyzer :: User Guide Cisco PIX Firewall Reports 1. I am not seeing Traffic reports in Cisco firewall's? 1. In your Cisco PIX command line interface execute the command show logging and check the trap logging value. 2. The trap logging should be set to informational for traffic logs to be generated from Cisco PIX firewall's Execute the command logging trap informational to set the trap logging to informational. 3.
ManageEngine Firewall Analyzer :: User Guide sa_spi= 0x94e99fdc(2498338780), sa_trans= esp-3des esp-md5hmac , sa_conn_id= 45 Cisco ASA: <166>:Apr 10 15:26:51 CDT: %PIX-vpn-6-602303: IPSEC: An inbound remote access SA (SPI= 0x2C4009CD) between xxx.xxx.xxx.xxx and xxx.xxx.xxx.xxx (user= ARNOLD) has been created <166>:Apr 10 22:13:21 CDT: %PIX-vpn-6-602304: IPSEC: An inbound remote access SA (SPI= 0xA57F6150) between xxx.xxx.xxx.xxx and xxx.xxx.xxx.
ManageEngine Firewall Analyzer :: User Guide 3. My Attack Reports displays "No Data Available"? Cisco firewall's have inbuilt Intrusion Detection Systems (IDS) that detects the attacks. Firewall Analyzer supports all attack logs in Cisco firewall devices. All the attacks are identified by the cisco ids from 400000 to 400050. Apart from these logs, Firewall Analyzer also identifies supports ID's like 106016, 106017 etc.
ManageEngine Firewall Analyzer :: User Guide Other Firewall Reports (Sonicwall, Fortigate, and all other firewall's that support WELF 1. My reports show No Data Available? This means Firewall Analyzer has discovered your firewall and is able to recognize the logs. By default, as soon as you login, Firewall Analyzer shows data from current day's 00:00:00 hrs to current time of the machine where you are running Firewall Analyzer.
ManageEngine Firewall Analyzer :: User Guide 1902-01-16 08:52:47 Local0.Info 192.168.14.3 "id=firewall sn=0006B10C5210 time="2006-01-06 15:53:30 UTC" fw=myfirwall pri=6 src=xxx.xxx.xxx.xxx dst=xxx.xxx.xxx.xxx proto=tcp/http op=GET sent=1533 rcvd=512 result=200 dstname=c.microsoft.com arg=/trans_pixel.asp?source=msdn&TYPE=PV&p=library_enus_cpguide_html&URI=%2flibrary%2ft 7.
ManageEngine Firewall Analyzer :: User Guide Troubleshooting Tips For the latest Troubleshooting Tips on Firewall Analyzer, visit the Troubleshooting Tips on the website or the public user forums. General [ Show/Hide All ] 1. Where do I find the log files to send to Firewall Analyzer Support? The log files are located in the /server/default/log directory. Typically when you run into a problem, you will be asked to send the serverout.
ManageEngine Firewall Analyzer :: User Guide 5. How to increase the time limit of web client time out? To increase the time limit of web client time out, follow the steps given below: • • • • Shutdown/stop the Firewall Analyzer application Rename/remove the C:\ME\Firewall\server\default\log directory into log_old directory.
ManageEngine Firewall Analyzer :: User Guide 3. Firewall Analyzer is running as a service in SUSE Linux machine. On reboot, Firewall Analyzer service is not getting started. How to overcome this? If Firewall Analyzer is running as a service in SUSE Linux machine and on reboot the Firewall Analyzer service is not getting started, carry out the following procedure. • • • • • • • • Open a Command window with Super User privileges, on the SUSE Linux machine Execute the YaST program.
ManageEngine Firewall Analyzer :: User Guide 2. Firewall Analyzer displays "Port 8500 needed by Firewall Analyzer is being used by another application. Please free the port and restart Firewall Analyzer" when trying to start the server. Probable cause: The default web server port used by Firewall Analyzer is not free. Solution: Kill the other application running on port 8500. If you cannot free this port, then change the web server port used in Firewall Analyzer. 3.
ManageEngine Firewall Analyzer :: User Guide last received log time. It is better to run the server continuously and check whether 5000 records are collected. Do not stop and restart the server inbetween! Moreover, for viewing the already collected log records in the reports, kindly do the following: 1. Login into Firewall Analyzer client UI. You will be seeing the Dashboard page. 2. Replace the URL shown in your browser with the following URL. http://localhost:8500/fw/genreport.do 3. Wait for sometime.
ManageEngine Firewall Analyzer :: User Guide 7. My firewall is sending WELF logs, but the reports do not show any URL information? Firewall Analyzer checks for the entry "arg=your URL" in the firewall logs to populate and show URL in report data. If this entry is not present in the firewall logs then the reports wouldn't be showing any URL information. 8. In the Compliance Report field, the following message appears: 'Unable to generate compliance report. Reason: Failed to locate Nipper.
ManageEngine Firewall Analyzer :: User Guide Other Tools and Utilities Configuring Firewall Analyzer Parameters You can configure Firewall Analyzer to handle . Firewall Analyzer User Input Configuration To carry out the advanced configuration in the Firewall Analyzer, access the following URL in the browser: http://:8500/fw/userConfig.do The Firewall Analyzer User Input Configuration page will be displayed. Enter the values and select the options as per your requirement.
ManageEngine Firewall Analyzer :: User Guide • Minimum Disk Space Setting: It allows you to set the minimum disc space (in GB) at which you would like to get warned. • Destination By Port: Applicable for Cisco PIX device. Setting this parameter allows Firewall Analyzer to decide the destination based on the minimum value between source and destination ports. • Nipper Location: For linux installation, provide the location where Nipper is installed.
ManageEngine Firewall Analyzer :: User Guide Configuring MSSQL Database Firewall Analyzer lets users to configure and use MSSQL database. The procedure to configure the MSSQL is applicable only for fresh installation of Firewall Analyzer server. If you are already using the Firewall Analyzer with MySQL and you want to change the database to MSSQL, please refer the Migrating Firewall Analyzer Data from MySQL to MSSQL Database page and follow the procedure given there.
ManageEngine Firewall Analyzer :: User Guide 3. Database Setup Wizard pops-up. 4. In the wizard screen, select Server Type as SQL Server. Available SQL Server Instances are listed in a combo box. Enter the Host Name and Port of the SQL Server from the instances. 5. Select the authentication type using the "Connect Using:" options. 6. The options are: a. Windows Authentication For Windows Authentication, enter the Domain Name, User Name and Password.
ManageEngine Firewall Analyzer :: User Guide 7. Click Test button to check whether the credentials are correct. If the test fails, the credentials may be wrong, recheck and enter the correct credentials. 8. If you are not able to get the SQL Server instances, please check the following in the SQL Server: o SQL server is not installed in the selected machine. o There is a firewall blocking port 1434 on the server o If you are using SQL Server 2005, please start the 'SQL Server Browser' from the Services.
ManageEngine Firewall Analyzer :: User Guide 9. Clcik Save button to save the SQL Server configuration. Note that, it will take few minutes to configure the settings of the SQL Server database. 10. Start the Firewall Analyzer Server/Service to work with the MS SQLSERVER as the database. From the installed MS SQLSERVER, copy the files bcp.exe and bcp.rll to \mysql\bin folder. Zoho Corp.
ManageEngine Firewall Analyzer :: User Guide Moving Firewall Analyzer's database to different directory in the same server To move the Firewall Analyzer's Indexes to a different drive/directory on the same server • • • • Go to Archive Settings page. Enable Change Raw Logs Indexing Location check box. Modify the Log Indexing Location to the new location and save. Move all the directories from previous location to the new location.
ManageEngine Firewall Analyzer :: User Guide After adding the "--datadir" attribute to the command, the start command will look like: #default $DB_HOME/bin/mysqld --no-defaults --basedir=$DB_HOME -datadir=/advent/5g/Working/Latest/data --port=$DB_PORT -socket=$TMP_HOME/mysql.sock --user=root..............
ManageEngine Firewall Analyzer :: User Guide 7. Verify the changed location by using the following commands: use firewall go sp_helpfile go Start the Firewall Analyzer Server/Service. Zoho Corp.
ManageEngine Firewall Analyzer :: User Guide Moving Firewall Analyzer Server installation to another server Moving Firewall Analyzer installation to new server with MySQL Moving Firewall Analyzer installation to new server with MS SQL Moving Archive, Index files to new server • • • How to move Firewall Analyzer installation to a new server? Ensure that the License file in the old server is copied to the new server after moving the Firewall Analyzer to the new server.
ManageEngine Firewall Analyzer :: User Guide 8. Restart the Firewall Analyzer on the new machine and check whether the data and configurations are intact. To move the Firewall Analyzer's Indexes to new server • • • • Go to Archive Settings page. Enable Change Raw Logs Indexing Location check box. Modify the Log Indexing Location to the new location and save. Move all the directories from previous location to the new location.
ManageEngine Firewall Analyzer :: User Guide Running Firewall Analyzer and MySQL database in different machines How to run Firewall Analyzer server and MySQL server in different machines? Carry out following steps to run the MySQL server in a separate machine. • • Stop the Firewall Analyzer server/service. Edit /server/default/deploy/mysql-ds.xml with the following line.
ManageEngine Firewall Analyzer :: User Guide Configuring Secure Communication - SSL The SSL protocol provides several features that enable secure transmission of Web traffic. These features include data encryption, server authentication, and message integrity. You can enable secure communication from web clients to the Firewall Analyzer server using SSL. The steps provided describe how to enable SSL functionality and generate certificates only.
ManageEngine Firewall Analyzer :: User Guide Enabling HTPPS (SSL) • In the same file, enable the HTTPS connection parameters, by removing the tag after the following lines:
ManageEngine Firewall Analyzer :: User Guide Using the existing SSL certificate • • • • You can export the Wild card certificate to a .pfx file and then follow the instructions given below to configure the same in Firewall Analyzer. Stop ManageEngine Firewall Analyzer service Copy the .pfx file to the location \server\default\conf Go to the location \server\default\deploy\jbosswebtomcat50.sar and open the file server.
ManageEngine Firewall Analyzer :: User Guide (For example: keytool -genkey -alias tomcat -keyalg RSA -keystore chap8.keystore) 2. You will be prompted to choose a password for your keystore. You will then be prompted to enter your Organization information. When it asks for first and last name, DO NOT mention your first and last name, but rather it is your Fully Qualified Domain Name for the site you are securing say, helpdesk.yourdomain.com.
ManageEngine Firewall Analyzer :: User Guide 3. Install the intermediate certificates if any. (Follow the instructions provided by the CA) 4. Install the Primary Certificate file: o Type the following command to install the Primary certificate file: keytool -import -trustcacerts -alias tomcat -file .crt -keystore chap8.
ManageEngine Firewall Analyzer :: User Guide How to bind specific interface of the machine to Firewall Analyzer application? How to bind specific interface of the machine to Firewall Analyzer application? For customers of version 6.0 or higher For customers of version 5.0 or lesser • • For customers of version 6.
ManageEngine Firewall Analyzer :: User Guide To shutdown Firewall Analyzer use the below command shutdown.bat -S -s : where in the above command is the one which you have set in sample-bindings.xml For Windows machine (running as service) • • • • • • Stop the Firewall Analyzer service. Open the startDB.
ManageEngine Firewall Analyzer :: User Guide • • • Open the mysql-ds.xml file which is under /server/default/deploy directory and replace localhost in connection-url tag with the to which you wants to bind the application and save the file. Open the sample-bindings.xml file which is under /server/default/conf directory and go to "jboss port setting block", follow the instructions over there, make necessary changes and save the file.
ManageEngine Firewall Analyzer :: User Guide For customers of version 5.0 or lesser • • • • For For For For Windows Machine: (running as application) Windows Machine: (running as service) Linux Machine: (running as application) Linux Machine: (running as service) Through out the below document, replace with the IP address with which you wants to bind the application. For Windows Machine: (running as application and not as service) • • • Shutdown Firewall Analyzer. Open the startDB.
ManageEngine Firewall Analyzer :: User Guide Before setting the port it will look like After setting the port it will look like is the port number which you have configured and not used by any application. • Restart Firewall Analyzer. To shutdown Firewall Analyzer use the below command shutdown.
ManageEngine Firewall Analyzer :: User Guide For Linux Machine: (running as application and not as service) • • • Shutdown Firewall Analyzer. Open the startDB.sh file which is under /bin directory and add option --bind-address= in the mysqld start command that starts with $DB_HOME and save the file. Open the stopDB.sh file which is under /bin directory and add -h to the command arguments and save the file.
ManageEngine Firewall Analyzer :: User Guide Before setting the port it will look like After setting the port it will look like is the port number which you have configured and not used by any application. • Restart Firewall Analyzer. To shutdown Firewall Analyzer use the below command ./shutdown.
ManageEngine Firewall Analyzer :: User Guide "wrapper.app.parameter.2=L../lib/AdventNetDeploymentSystem.jar". Add the following new application parameters wrapper.app.parameter.3=-c default wrapper.app.parameter.4=-b wrapper.app.parameter.5=-Dspecific.bind.address= and save the file. Remove "#" symbol for uncommenting in the .conf file. • • Open the mysql-ds.
ManageEngine Firewall Analyzer :: User Guide How to move Firewall Analyzer Raw Logs Archive and Raw Logs Indexing directory to mapped network drive? To move the Firewall Analyzer Raw Logs Archive and Raw Logs Indexing directory to mapped network drive, the procedure is slightly different for running the Firewall Analyzer as an application and service. The procedure to move to mapped network drive is given separately.
ManageEngine Firewall Analyzer :: User Guide Note: After you configure the new location for the Raw Log Index files, ensure that you copy all the files and sub-folders of the hot, warm, and cold subfolders of the indexes folder from the existing location to the newly configured location. Firewall Analyzer started as service In the remote machine in which you want to store raw logs archive and indexing, carry out the following procedure: • • • • Create/select the folder in the remote machine.
ManageEngine Firewall Analyzer :: User Guide Distributed Edition - Collector Server Introduction - Firewall Analyzer Distributed Edition Collector Server An enterprise spread across geography finds it difficult to manage the Firewalls in different branch office locations. To simplify this task Firewall Analyzer provides Distributed Edition. This edition employs distributed model.
ManageEngine Firewall Analyzer :: User Guide Installing and Uninstalling - Distributed Edition Collector Server Firewall Analyzer is available for Windows and Linux platforms. For more information on supported versions and other specifications, look up System Requirements.
ManageEngine Firewall Analyzer :: User Guide Configure new Program Folder or retain the default. Click Next button. The installation details like Installation Directory, Program Folder, and Web Port are displayed. Click Next button. Now, Distributed Edition - Collector server installation is complete. • • • Once the installation is complete you will notice a the following options.
ManageEngine Firewall Analyzer :: User Guide Collector Server is behind Proxy Server, select Use a Proxy Server to contact Admin Server check box. Configure the Proxy Server Host, Proxy Server Port, User Name, and Password details. Click Next button. Select Destination Folder using Browse button, for installation. Click Next button. Retain or modify the Web Port of Collector Server and select the Language of Installation from the combo box.
ManageEngine Firewall Analyzer :: User Guide Troubleshooting Tips - Distributed Edition Collector Server For the latest Troubleshooting Tips on Firewall Analyzer, visit the Troubleshooting Tips on the website or the public user forums. Zoho Corp.
ManageEngine Firewall Analyzer :: User Guide Integrating Firewall Analyzer with OpManager You can integrate Firewall Analyzer with OpManager. Pre-requisites To integrate Firewall Analyzer with OpManager • • • • OpManager application should be installed and running. Firewall Analyzer application should be installed and running. The Servers and Firewalls, whose logs you want to monitor and analyze must be discovered/added in OpManager and Firewall Analyzer.
ManageEngine Firewall Analyzer :: User Guide d. e. f. g. Top Top Top Top Denied Requests Attacks conversations Protocol Groups For Firewalls 1. 2. 3. 4. Go to the Servers map. Click the required server icon in the Servers map to see its snapshot page. Click the Reports combo box. Select one of the reports as required: a. Traffic Reports b. Security Reports c. All Reports You will be prompted to log on with the Firewall Analyzer's administrator user name and password the first time you view the report.
ManageEngine Firewall Analyzer :: User Guide Using Ask ME The Ask ME tab offers a quick way to see just the reports that you need, without having to create a new report profile, or drilling down through the pre-defined reports. Ask ME enables managers and other non-technical staff to answer simple but critical questions about bandwidth usage and network security. The Ask ME tab shows a series of questions. In Step 1, select the area of interest in the "I have a question about...
ManageEngine Firewall Analyzer :: User Guide Contacting Technical Support The Support tab gives you a wide range of options to contact the Technical Support team in case you run into any problems.
ManageEngine Firewall Analyzer :: User Guide Procedure to create a Support Information File (SIF) and send the SIF to Firewall Analyzer support We would recommend the user to create a Support Information File (SIF) and send the SIF to fwanalyzer-support@manageengine.com The SIF will help us to analyze the issue you have come across and propose a solution. The instructions for creating the SIF is as follows: • • • • • Login to the Web-client and click the Support tab.