
User`s manual


IKS-6726 Featured Functions
3-67
LLDP Web Interface
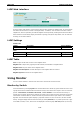
From the switch’s web interface, users have the option of either enabling or disabling LLDP, as well as setting
the LLDP transmit interval (as shown in the figure below). In addition, users are able to view each switch’s
neighbor-list, which is reported by its network neighbors. Most importantly, enabling the LLDP function allows
Moxa’s MXview to automatically display the network’s topology and system setup details, such as VLAN and
Trunking, for the entire network.
LLDP Settings
Enable LLDP
Setting Description Factory Default
Enable or Disable Enable or disable the LLDP function. Enable
Value
Setting Description Factory Default
5 to 32768 secs Sets the transmit interval of LLDP messages, in seconds. 30 (seconds)
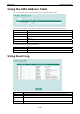
LLDP Table
Port: The port number that connects to the neighbor device.
Neighbor ID: A unique entity (typically the MAC address) that identifies a neighbor device.
Neighbor Port: The port number of the neighbor device.
Neighbor Port Description: A textual description of the neighbor device’s interface.
Neighbor System: Hostname of the neighbor device.
Using Monitor
You can monitor statistics in real time from IKS-6726’s web console and serial console.
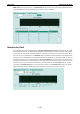
Monitor by Switch
Access the Monitor by selecting System from the left selection bar. Monitor by System allows the user to view
a graph that shows the combined data transmission activity of all of IKS-6726’s 18 ports. Click one of the four
options—Total Packets, TX Packets, RX Packets, or Error Packets—to view transmission activity of
specific types of packets. Recall that TX Packets are packets sent out from IKS-6726, RX Packets are packets
received from connected devices, and Error Packets are packets that did not pass TCP/IP’s error checking
algorithm. The Total Packets option displays a graph that combines TX, RX, and TX Error, RX Error Packets
activity. The graph displays data transmission activity by showing Packets/s (i.e., packets per second, or pps)
versus sec. (seconds). In fact, three curves are displayed on the same graph: Uni-cast packets (in red color),