
User`s manual


EDR-G903/G902 Features and Functions
3-63
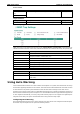
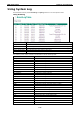
Neighbor Port Description: A textual description of the neighbor device’s interface.
Neighbor System: Hostname of the neighbor device.
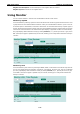
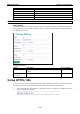
Using Monitor
You can monitor statistics in real time from the EtherDevice Router’s web console.
Monitor by System
Access the Monitor by selecting “System” from the left selection bar. Monitor by System allows the user to view
a graph that shows the combined data transmission activity of all the EtherDevice Router’s 3 ports. Click one
of the three options—Total Packets, TX Packets or RX Packets—to view transmission activity of specific types of
packets. Recall that TX Packets are packets sent out from the EtherDevice Router, and RX Packets are packets
received from connected devices. The Total Packets option displays a graph that combines TX and RX activity.
The graph displays data transmission activity by showing Packets/s (i.e., packets per second, or pps) versus
sec. (seconds).The graph is updated every few seconds, allowing you to analyze data transmission activity in
real time.
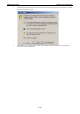
Monitor by Port
Access the Monitor by Port function by selecting the WAN1, WAN2, or LAN interface from the left drop-down list.
You can view graphs that show All Packets, TX Packets, or RX Packets, but in this case, only for an individual
port. The graph displays data transmission activity by showing Packets/s (i.e., packets per second, or pps)
versus sec. (seconds).The graph is updated every few seconds, allowing you to analyze data transmission
activity in real time.