
Specifications


11-20 WS2000 Wireless Switch System Reference Guide
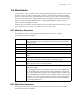
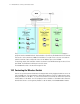
Select [Status & Statistics] --> Statistical Graphs from the navigation menu on the left. The Graphical
Display of Statistics screen appears.
To create a graph that will remain on your screen until you close it, follow these steps:
1. Select the type of Entity (WAN, SUBNET, WLAN, AP, or MU) that you want to display from the menu.
2. Select the particular member that you want to watch from the Member menu.
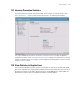
3. Select the data to monitor. Depending on the selected entity type, one or more of four radio buttons will
become available to choose from. The radio button selection indicates what is being monitored (graphed
on the X axis). Selections can be one of:
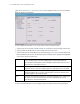
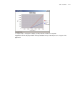
4. Click the MONITOR button to open the graphics window. A window like the following will appear.
Pkts If selected, the switch will monitor and graph packet traffic statistics. Select one or
more of the eight values to monitor, including: packets received and transmitted,
received and transmitted packets that were dropped, reception and transmission errors,
and transmission and reception overruns.
RF If selected, the switch will monitor radio frequency statistics. Select one or more of the
different RF values to monitor, including: signal, noise, and signal-to-noise ratio (SNR).
Throughput If selected, the switch will monitor the switches throughput. Select one or more of the
different throughput values to monitor: total throughput, transmission received, trans-
mitted throughput or the average bit speed.
PPS If selected, information about packets per second will be graphed for the selected mem-
ber. Select one or more of the three values to monitor: total packets per second,
received packets, and transmitted packets.