
Specifications

Status & Statistics 11-15
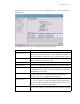
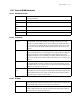
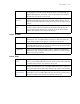
11.4.3.3 RF Status
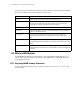
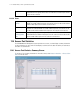
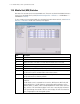
11.4.3.4 Errors
Avg. Bit Speed The Total column displays the average bit speed in Mbps for a given time period on
the selected Access Port.This includes all packets that are sent and received. The
number in black represents this statistic for the last 30 seconds and the number in
blue represents this statistic for the last hour.
Approx RF
Utilization
The approximate utilization of the Access Port’s RF port. This is calculated as
Throughput divided by Average bit speed. The number in black represents this sta-
tistic for the last 30 seconds and the number in blue represents this statistic for the
last hour.
% Non-unicast
pkts
Displays the percentage of the total packets for the selected Access Port that are
non-unicast packets. Non-unicast packets include broadcast and multicast pack-
ets.The number in black represents this statistic for the last 30 seconds and the
number in blue represents this statistic for the last hour.
Avg MU Signal Displays the average RF signal strength in dBm for all MUs associated with the
selected Access Port. The number in black represents this statistic for the last 30
seconds and the number in blue represents this statistic for the last hour.
Avg MU Noise Displays the average RF noise for all MUs associated with the selected Access Port.
The number in black represents this statistic for the last 30 seconds and the number
in blue represents this statistic for the last hour.
Avg MU SNR Displays the average Signal to Noise Ratio (SNR) for all MUs associated with the
selected Access Port. The Signal to Noise Ratio is an indication of overall RF perfor-
mance on your wireless networks.
Avg Num of
Retries
Displays the average number of retries for all MUs associated with the selected
Access Port. The number in black represents this statistic for the last 30 seconds and
the number in blue represents this statistic for the last hour.
% Gave Up Pkts Displays the percentage of packets which the switch gave up on for all MUs associ-
ated with the selected Access Port. The number in black represents this statistic for
the last 30 seconds and the number in blue represents this statistic for the last hour.
% of
Undecryptable
Pkts
Displays the percentage of undecryptable packets for all MUs associated with the
selected Access Port. The number in black represents this statistic for the last 30 sec-
onds and the number in blue represents this statistic for the last hour.