
User guide


19
two thresholds. However, in reality the temperature oscillates around values.
When for instance MIN_TEMP is reached, the temperature oscillates around
MIN_TEMP +/- DELTA_TEMP. This would result in sending e-mails all the
time while the temperature gradually increases around TEMP_MIN value. To
prevent that, we use a hysteresis, i.e. we do not send e-mails until the temperature
is between MIN_TEMP + DELTA_TEMP and MAX_TEMP – DELTA_TEMP.
• The application can upload the collected values of temperature periodically, after
an interval specified by the user.
• The application can upload the data at user request. In this case, it will send all the
values collected from the beginning of the interval that are stored in the database.
After sending the e-mail or uploading the data (successfully or unsuccessfully), the
application terminates the TCP/IP connection in order to free the serial port for IR link.
After that, it will resume monitoring the temperature in the loop.
The Server
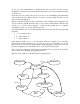
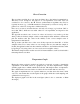
The functionality of the server is very simple. It receives all the data sent by the client
into a text file. Based on this file it generates a graph showing the temperature variation.
We used gnuplot for drawing the graph. The image is later included in a web page,
updated with the last upload time stamp, and can be accessed on the Internet, with any
available Web browser. The Web page of the project is
http://www.ics.uci.edu/~isse/proj213/.
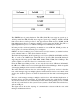
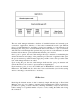
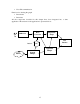
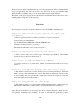
Database
Server
- receives data
- generates graph
Network
Manager
Client
(Palm)