
User guide

15
Error Correction
The procedure specified above can detect problems due to the infrared communication.
This may not be enough for the purpose of our experiment: even if the bytes are
considered to be correct by the IR receiver synchronization algorithm, they may be
logically incorrect (e.g.: weak IR transmission, interpreted by receiver in wrong data or
packets lost or data out of range due to different factors).
First, we try to remove all values that are obviously out-of-range (e.g. less than -50°C or
more than 150°C, which are reasonable values for our experiments, and depend on the
application).
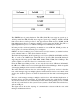
The approach we take in case of errors, in order to at least try to recover the good data
when possible is relatively simple: collect several sampled values and then sort them and
pick the median value (the value in the middle) as the correct sampled value of
temperature for that interval.
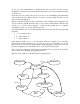
This procedure can filter most of the errors if they represent less than 50% of all the
sampled values. If too many values are out-of-range, then we just mark the sample as
invalid (the application that uses these numbers will have to deal with invalid data, either
by ignoring it or by using some sort of recovery based on neighbor values).
The filtered sampled values are then stored in an internal database, each associated with a
timestamp when it was taken.
Temperature Graph
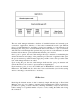
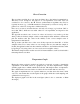
Having the values received form the board and error corrected, we want to dynamically
output them on the Palm screen in a graphical way. We have implemented a simple
dynamic graph viewer on Palm, which shows the last 130 sampled values of temperature.
Due to Palm limited screen resolution we cannot show more than that in a clear way.
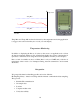
The graph is implemented in two separate functions (one that draws the frame, called
only once, and another that does the update of the graph, called after each sampling, and
optimized for fast response).
The displayed graph looks like in the next figure (there is also a screenshot of Palm
showing it)