
User guide


552
pmp-0229 (Mar 2013)
Using the Remote Spectrum Analyzer Tool (AP)
Using Tools in the GUI
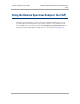
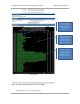
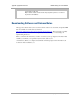
Figure 189: Remote Spectrum Analyzer tab of AP, example
This feature proceeds in the following sequence:
Green bars indicate
the average signal
strength per frequency
over the duration of
the scan
Yellow bars indicate
maximum received
signal strength per
frequency over the
duration of the scan
Red bars indicate
received signal
strength greater than
-40 dBm over the
duration of the scan